


Key Findings
-
The Google Analytics for Local Businesses Study explores anonymous Google Analytics data from over 11,000 websites to help local businesses benchmark against their industry
-
Local businesses attract 414 monthly users and 506 sessions on their website on average
-
The average local business's website receives 2.17 pages per session, while mobile-only visitors visit an average of just 1.88 pages
-
50% of local businesses' traffic comes from organic, with 37% coming from direct sources. The average local business reports no email, paid, or display sessions each month - though this could be down to tracking being set up incorrectly
-
Organic traffic for local businesses dropped between 2017 and 2018, while referral traffic saw significant growth
-
Car dealerships lead the way in website traffic - seeing high pages per session, and session durations, and low bounce rates
-
54% of websites don't have goals set up in Google Analytics. Those that do are most likely to be tracking interactions from customers
Google Analytics is undoubtedly one of the most useful tools out there to understand your digital performance, no matter your website’s size. It allows users to track their website visitors, measuring traffic across different online channels over time. For local businesses, however, it can be difficult to know which metrics to watch.
With research finding that 92% of consumers visit local businesses’ websites when deciding which business to use, it’s never been more important for local businesses to be monitoring how their website is performing.
But, for local businesses, we know it can be hard to know what’s ‘normal’ in your industry, and what you should be striving for. Following the positive reception we got from the Google My Business Insights Study, we wanted to provide our readers with even more data to help them benchmark their own performance, as well as providing data for marketers to help prove the importance of tracking websites to customers.
To do this, we reviewed anonymous Google Analytics data from more than 11,000 local businesses to track trends over time. We reviewed data across 17 months, 28 industries, and 4 countries to provide an in-depth exploration of trends among local businesses using Google Analytics.
For more information on the dataset, we’ve included a full methodology at the end of this article. If you have any additional thoughts or comments on the findings of the Google Analytics for Local Businesses Study, please leave a comment below, or get in touch with any questions.
Contents
- Users
- Sessions
- Channels
- Pageviews
- Pages / Session
- Average session duration
- Bounce rate
- Goals
- Full data and downloads
- Methodology
Users
Users refers to the number of unique users to the site each month. This includes both new visitors navigating to your site for the first time on a device and returning visitors, who have visited the site at some point in the last 2 years using the same device.
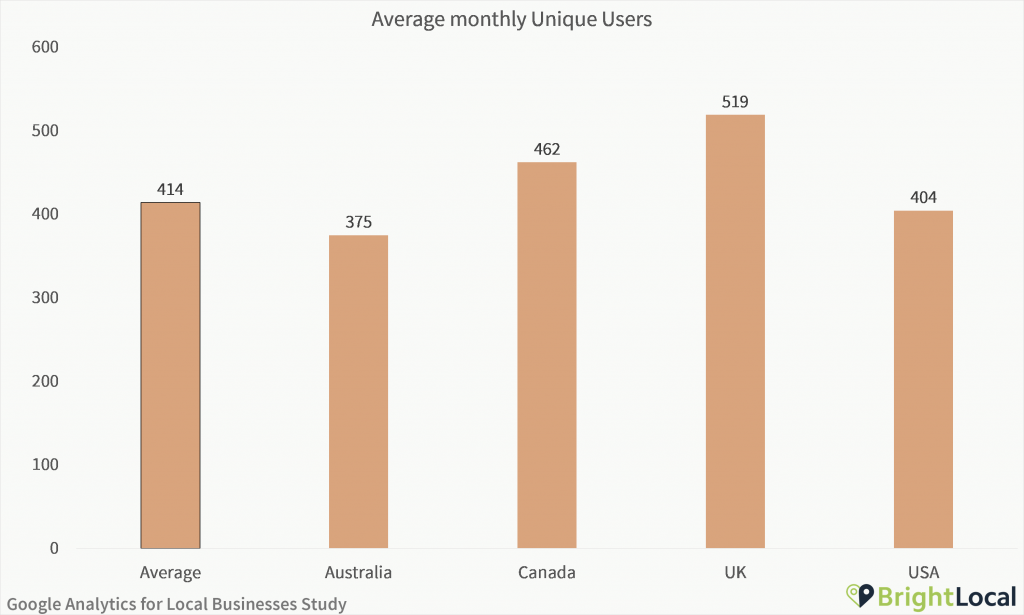
Average monthly Unique Users
Key Findings
- The average local business attracts 414 users to their website each month
- Unique website users vary dramatically by industry – with the average car dealership receiving significantly more
- 13% of local businesses receive fewer than 100 users to their sites each month. 55% receive fewer than 500
A typical local business has 414 users to its website on a monthly basis – nearly 5,000 per year.
But, user numbers differ across countries. Businesses in the UK have the highest median monthly users, while Australian businesses have the lowest.
Growing the number of users to your website can be incredibly beneficial for many businesses. There are many things you can test to increase the number of users visiting your site: you could focus on ranking highly in both local and localized organic search results; promote your brand on social media or through business listings and referral links; or you could consider using paid ads to boost your online visibility. Here are some tips to help your business get noticed.
Grouped average monthly Unique Users
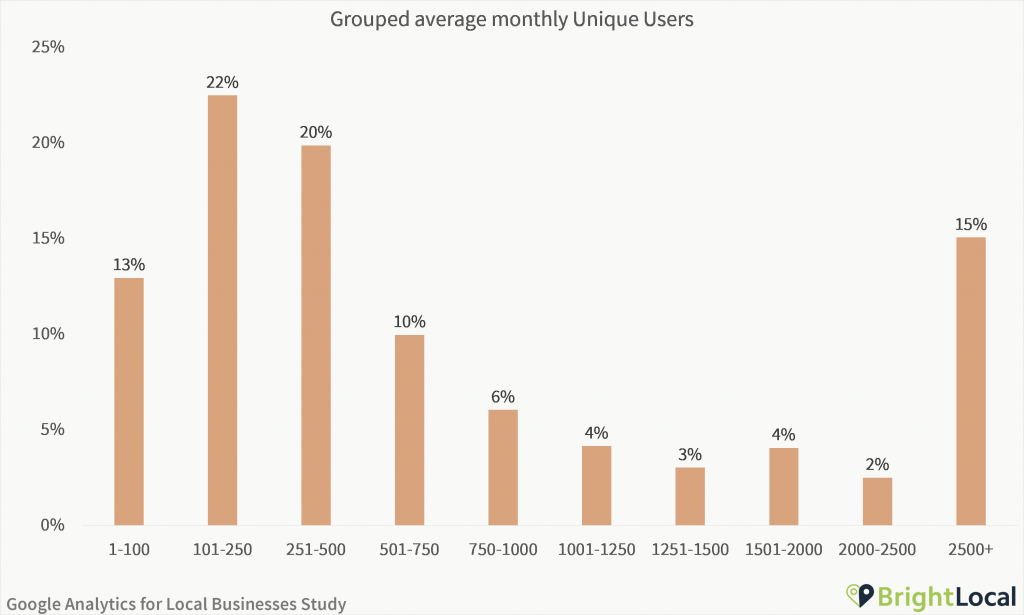
Many local businesses receive very few visitors to their sites on a monthly basis. 13% receive less than 100 users each month, with 55% seeing less than 500.
But, it’s important to note that many local businesses are part of a chain, and thus share a Google Analytics account – skewing a small proportion of results. This is likely to account for the 15% that receive more than 2,500 users each month, though of course, some popular sole traders will be reaching these heights!
Understanding the number of individual users visiting your site helps you to understand the behavior of your potential customers. Within the BrightLocal toolset, we allow users to connect their Google Analytics account so that they can simply see all of the information about their business in one place, as well as being able to compare ranking changes with Analytics data. Sign up for a free trial.
Average monthly Unique Users by industry
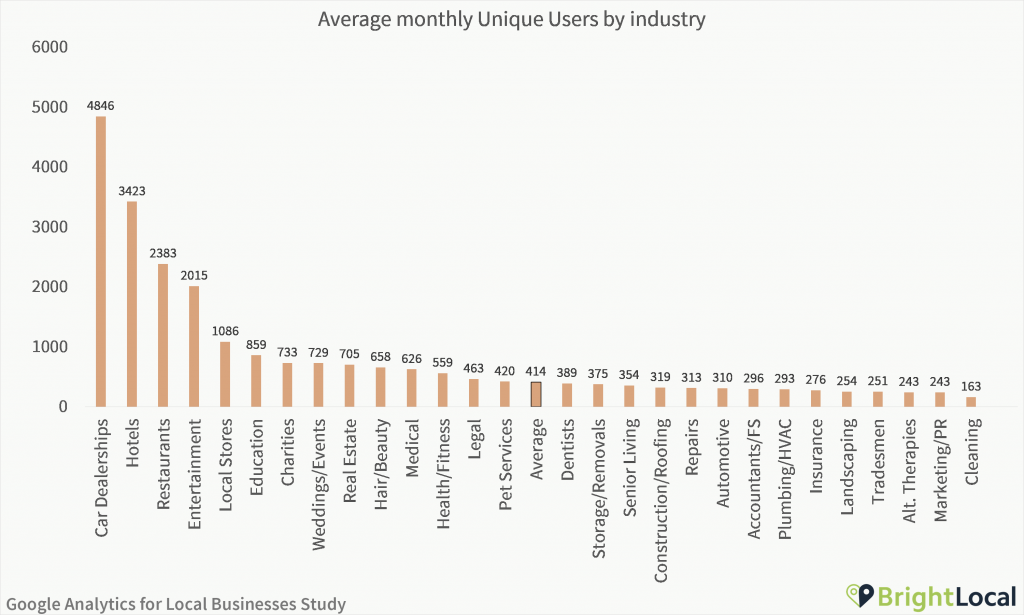
The industries with the most website users
- Car dealerships
- Hotels
- Restaurants
- Entertainment
- Local stores
Of all the industries reviewed in this study, hospitality and entertainment-related businesses receive notably high volumes of people to their sites. As mass appeal businesses that will attract more customers than some rarer use industries, this is no big surprise.
But, it’s car dealerships that are really leading the way. In our recent Google My Business Insights Study, we identified dealerships as a leading industry in GMB usage, so it’s no surprise to see them also speeding away with Google Analytics usage as well. Visiting a dealership’s website is a critical stage of the buyer journey for many consumers, with people often doing intensive research into the cars and prices available at a dealership long before visiting.
However, while Google My Business Insights are tied to just one location, it is highly plausible that car dealerships are an industry that has a higher-than-usual proportion of chains. This could go some way in explaining the significant median website users for dealerships being 10x that of the average business.
Websites for businesses focusing on cleaning, marketing, and alternative therapies receive the lowest number of visitors each month. This could be attributed to a lower volume of need (more people will be looking for a bar than a cleaner on a regular basis!), with many businesses receiving low volumes of users, and the most successful bringing up the average from the other end.
Sessions
Sessions refers to one user’s interactions with your website. This can include multiple pageviews, as well as event interactions, social interactions, and eCommerce transactions. Sessions expire after 30 minutes of inactivity, or at midnight. If the same user visits your site through different campaigns, these count as different sessions.
Average monthly Sessions
Key Findings
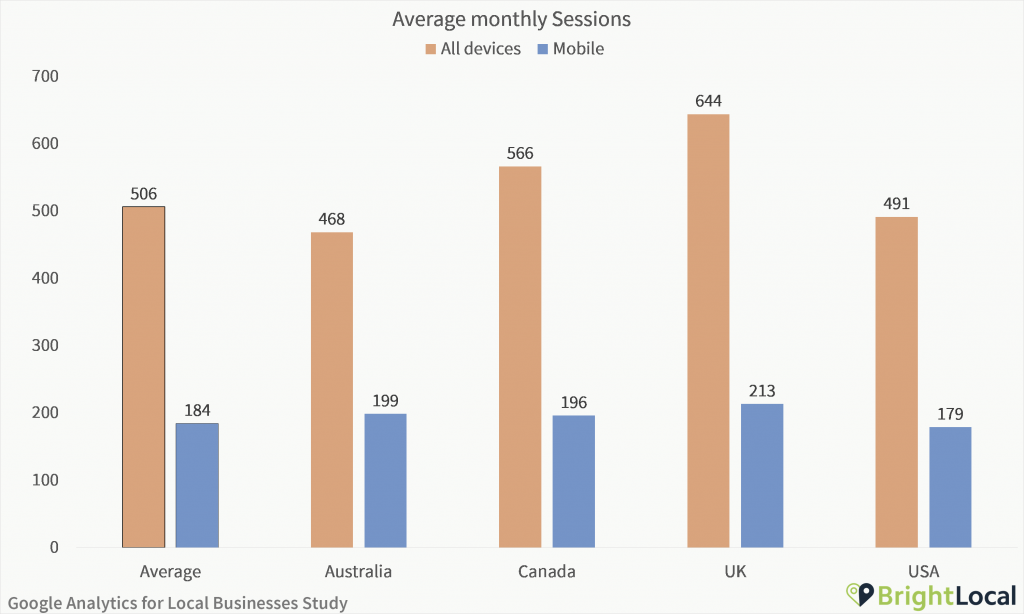
- The average local business receives 506 sessions per month
- Businesses in Australia have the highest proportion of mobile sessions
- 29% of local businesses receive fewer than 250 monthly sessions
The average local business receives 506 sessions each month, of which 36% are on mobile.
Sessions is one of Google Analytics’ most useful metrics for local businesses. Monitoring sessions allows you to track traffic to your site, including how each of the main acquisition channels is tracking over time. If you’re experiencing a drop in sessions, the first step would be to find out which channels may be seeing change.
When comparing by country, Canadian businesses receive the highest average number of sessions, while businesses in the UK receive the least. Interestingly, this trend lines up with findings from the Google My Business Insights Study, finding that Canadian businesses had the highest monthly GMB listing views, while the UK had the least. While there are many factors that make these two metrics distinct, it does suggest that the average businesses within these countries may see significantly different results.
But, it’s interesting to note that a high proportion of Australian businesses’ sessions come from mobile – 43%. In the USA, this is 36%, with 35% for Canada, and the UK trailing behind with 33%.
Mobile devices are incredibly important for many industries and individual businesses. Smartphones are only getting smarter, with even more consumers expected to use these as their primary device over the next few years. A lower proportion of mobile traffic is not necessarily a negative trait, but it could signify a need for different content within your site. It’s important to understand how your own users are accessing your website and adapt content accordingly.
Grouped average monthly Sessions
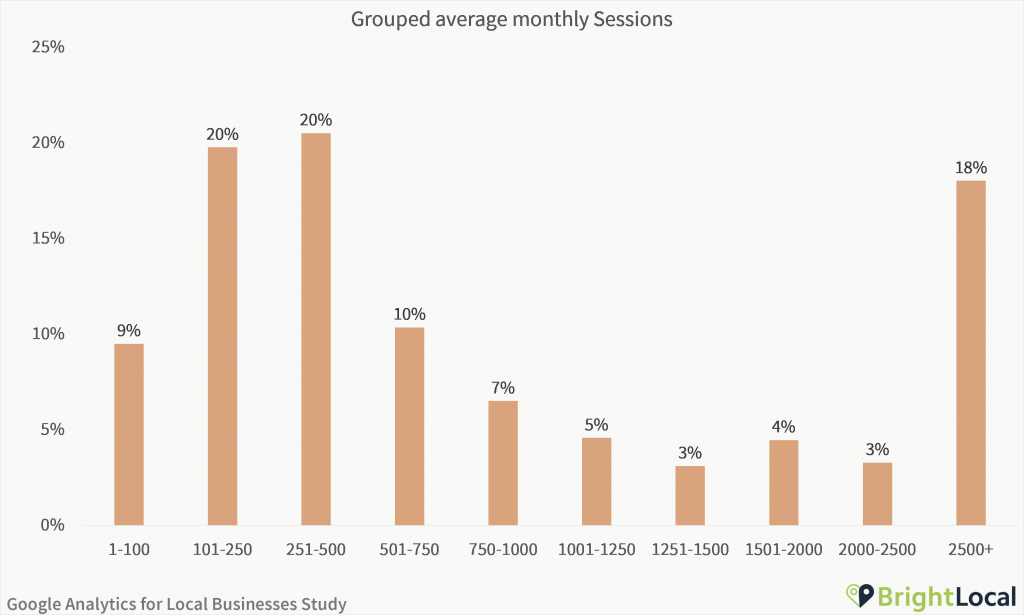
Very few businesses should expect to see mass usage of their site. 66% of local businesses have less than 1,000 sessions on their websites – with 29% receiving less than 250.
Local business websites vary greatly in both quality and needs, so it’s no surprise the spread of sessions is so varied. For example, an accountant with a low-ranking website, a low number of pages to land on, and no focus on other channels will be unlikely to see a high session count. This isn’t to say that they are an unsuccessful business, it may just be that they attract or convert customers in a different way.
Top Sessions by industry
| Industries | Sessions: All devices | Mobile: Sessions | Proportion of mobile traffic |
|---|---|---|---|
| Car Dealerships | 7602 | 3782 | 50% |
| Hotels | 4166 | 1775 | 43% |
| Restaurants | 2986 | 1726 | 58% |
| Entertainment | 2779 | 1393 | 50% |
| Education | 1142 | 465 | 41% |
| Local Stores | 1038 | 437 | 42% |
| Real Estate | 955 | 468 | 49% |
| Weddings/Events | 954 | 443 | 46% |
| Charities/Organizations | 917 | 226 | 25% |
| Hair/Beauty | 819 | 382 | 47% |
Download the full industry data in the csv at the end.
In many types of business, consumers may be less likely to view the website as a key part of the journey – perhaps only needing the information held on Google My Business, Facebook, or Yelp listings, or opting instead to contact or visit the business directly.
Likewise, industries such as cleaning, tradesmen, and landscapers rarely require multiple website visits, or a lengthy decision-making process. Therefore, many businesses will only see one session from a user, while car dealerships may see the same customer starting multiple sessions over time before making a decision to get in touch.
When looking at how consumers are interacting with different industries’ websites, it’s interesting to look at how many sessions are from mobile. Of all the industries, restaurants receive the highest proportion of mobile sessions (58%), with car dealerships, entertainment, and pet services all receiving more than half their average sessions from mobile.
The industries seeing the lowest proportion of mobile sessions are Marketing / PR (17%), Charities (25%), and Accountants and financial services (26%).
Channels
Average monthly Sessions by channel
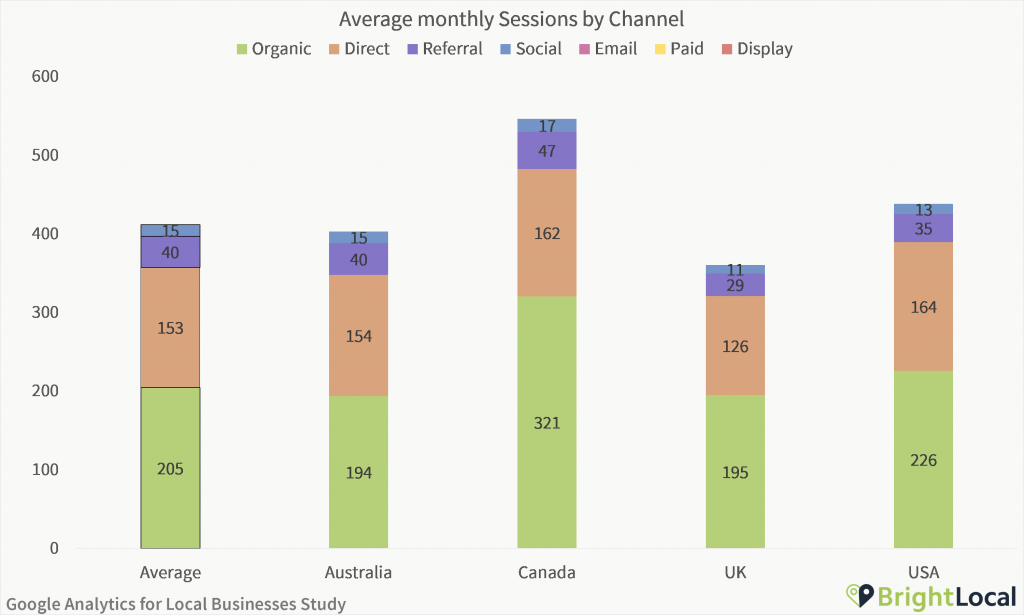
- 50% of website traffic comes from organic, with 37% coming from direct sources
- The average local business receives no email, paid, or display sessions each month
- Local businesses receive 205 monthly median organic sessions
For the average local business, half of all website traffic comes from organic sources, with a further 37% from direct. This equates to a median of 205 sessions from organic per month, and 153 from direct. Research by Groupon in 2014 estimated that up to 60% of direct traffic was from organic search, so it’s important for local businesses to be monitoring traffic across all channels to ensure they are tracking the full usage of site users.
Canadian businesses have the highest average organic sessions, with 59% of their traffic coming from search. In comparison, the UK has 54%, 52% in the US, and 48% in Australia.
There weren’t any businesses in our dataset that had no organic traffic at all, though 32% receive fewer than 100 organic sessions per month.
Average traffic proportion by Channel
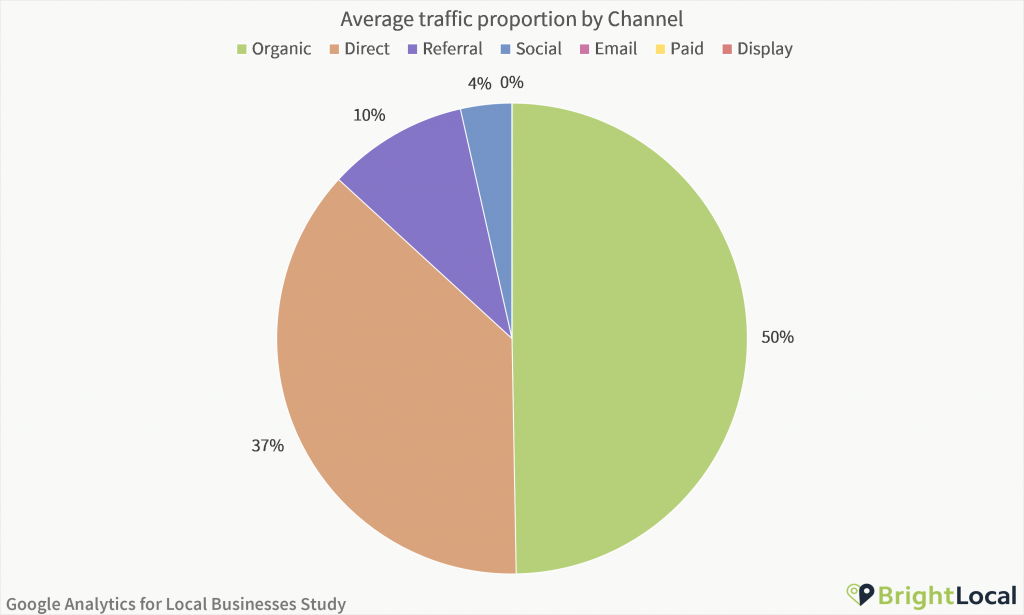
Interestingly, the average business doesn’t get any traffic from email, paid, or display channels. 81% of businesses in the study had an average of 0 monthly sessions from email. For paid, this was 57%, and 80% for display.
However, that is not to say that all of these local businesses aren’t using these channels. While very useful, Google Analytics isn’t perfect, and often miscategorizes data that it doesn’t know where to place. Many local businesses are likely to use email marketing providers such as Mailchimp that don’t automatically track emails, and instead need users to set this up through a tickbox (screenshot below). Potentially, less tech-savvy businesses may not be aware that this is possible, or understand the benefits of tracking traffic correctly. This traffic will instead be placed in other channels – probably direct.
![]()
Even without this tracking, it seems like not many local businesses are using email to receive a high volume of traffic. Just 4% of businesses received more than 100 monthly sessions from email sources. As a comparison, 20% of businesses receive more than 100 sessions from paid sources per month – suggesting that more businesses are using this channel successfully.
When looking at only the businesses that do have traffic from these channels, averages are noticeably higher. Businesses that do see traffic from email sources receive 4 sessions per month, paid sources equate to 81 monthly sessions, and display sees 41.
And it’s not just email that can see incorrect attribution. Social traffic is easily misplaced into referrals, while visits from Google My Business listings aren’t necessarily attributed to organic, and often get placed into direct.
If your GMB listing improves in the local rankings, and you see lower organic traffic but a growth in direct traffic, it may be that your Google My Business listing is seeing increased action. To combat this, consider adding UTM tags to your Google My Business listing, as well as closely monitoring your Google My Business Insights to keep an eye on how many people are seeing and clicking on your listing. And, if you’d like to view all of a business’s data in one place, we have a great dashboard that’s part of our platform of local SEO tools, that does just that!
| Industries | Organic | Direct | Referral | Social | Paid | Display | |
|---|---|---|---|---|---|---|---|
| Car Dealerships | 2532 | 1399 | 374 | 164 | 0 | 837 | 27 |
| Hotels | 1912 | 943 | 289 | 91 | 0 | 90 | 0 |
| Restaurants | 1389 | 878 | 83 | 97 | 0 | 0 | 0 |
| Entertainment | 1080 | 665 | 139 | 91 | 0 | 7 | 0 |
| Education | 571 | 280 | 63 | 23 | 0 | 0 | 0 |
| Local Stores | 460 | 265 | 58 | 35 | 0 | 0 | 0 |
| Weddings/Events | 446 | 232 | 59 | 44 | 0 | 2 | 0 |
| Medical | 395 | 192 | 48 | 21 | 0 | 0 | 0 |
| Real Estate | 390 | 203 | 42 | 25 | 0 | 0 | 0 |
| Hair/Beauty | 384 | 214 | 53 | 36 | 0 | 0 | 0 |
As shown in the table above, the average car dealership receives lots of traffic from paid sources, while entertainment-sector businesses perform well in referrals.
There are plenty of businesses that don’t need to do major promotion through some channels – for example, an urgent care facility is unlikely to be paying for traffic or marketing to its patients.
To find out which channels your industry excels in, explore the full dataset.
Average proportion of Organic Traffic by industry
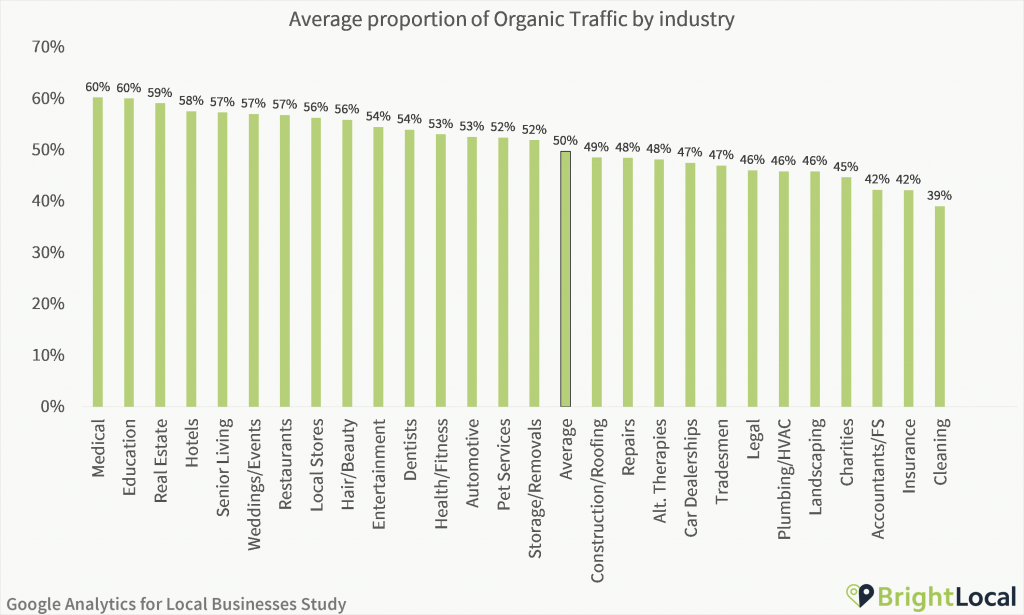
Some industries see drastically different proportions of traffic coming from organic sources traffic than others. Medical-sector businesses receive the joint highest proportion of organic sessions with education businesses (60%). Real estate, hotels, and senior living businesses also receive a significant chunk of traffic from search.
It’s a little surprising to see the average hotels receiving such a high proportion of their traffic coming from organic. Hotels have unique functionality in Google My Business results, as well as often having a high number of citations, and, as shown above, higher average traffic from paid and social sources. With hotels utilizing multiple channels well, you may expect the proportion of organic sessions to dip – highlighting quite how well the average hotel is performing in search.
At the other end of the scale, marketing businesses receive just 29% of traffic from organic sources. While this may seem shocking at first glance, it’s likely to be because marketers are more familiar with the other channels, and have higher usage of these – thus pushing down the proportion allocated to organic.
Cleaning companies, insurance businesses, and accountants all receive a comparatively low proportion of their traffic from organic sources. Instead, these businesses appear to be receiving a high volume of direct traffic – which could be attributed to performance in local results. Remember, a low proportion doesn’t necessarily equate to poor organic performance. Every business is different, and it’s important to compare your own results with others in your industry.
Year-on-year channel growth
| Organic | Direct | Referral | Social | Paid | Display | ||
|---|---|---|---|---|---|---|---|
| Q4 2017 Average | 225 | 151 | 19 | 10 | 0 | 0 | 0 |
| Q4 2018 Average | 202 | 152 | 50 | 12 | 0 | 0 | 0 |
| YOY Change | -10% | 0% | 157% | 20% | 0% | 0% | 0% |
In line with the Google My Business Insights Study, we wanted to see how the different channels performed across two distinct time periods – Q4 2017 and Q4 2018.
When comparing medians, we saw no change in email, display, and paid traffic (all with medians of 0 across both time periods). Referral traffic saw significant growth over the time period, with a median of 19 in 2017, and 50 for the same time the following year. Social traffic also saw growth, though this is from a small base.
The only channel that saw a decrease in monthly averages was organic. This dropped from 225 sessions per month in 2017 to 202 in 2018 – a drop of 10%. In comparison, Merkle’s Q4 2018 Digital Marketing Report reported a 2% year-on-year growth in organic search visits. While it could be a quirk of our dataset, this could indicate lower performance among local businesses, or, an increased number of local businesses starting out with measuring their website who may be affecting the overall average.
Pageviews
Pageviews are the number of pages viewed by users. This includes if one user viewed the same page multiple times. Google Analytics also provides information on unique pageviews, which only counts a page once no matter how many times it is viewed by one user in a session.
Average monthly Pageviews
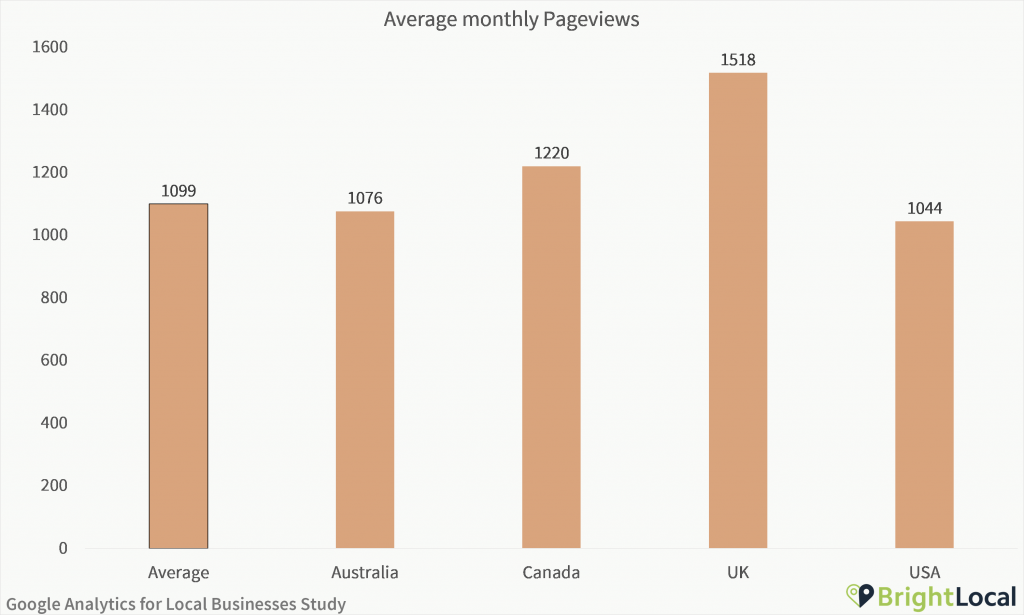
- Local businesses receive an average of 1,099 pageviews per month
- 47% of local businesses receive fewer than 1,000 pageviews in the average month
- Car dealerships receive significantly more pageviews than other industries. Cleaning businesses, tradesmen, and landscapers receive the lowest number of pageviews
The average local business gets 1,099 pageviews in an average month.
Businesses in the UK receive significantly more pageviews than their counterparts overseas – 38% more than the average local business. This tallies up with the higher proportion of users businesses in the UK get.
Of course, it’s important to remember that this is a median – meaning that businesses in the UK can’t expect to automatically receive higher pageviews than if they set up in another country. Perhaps instead, businesses in the other countries may see more competitors for traffic (and customers), driving down the average for those not winning in rankings.
Average monthly Pageviews by industry
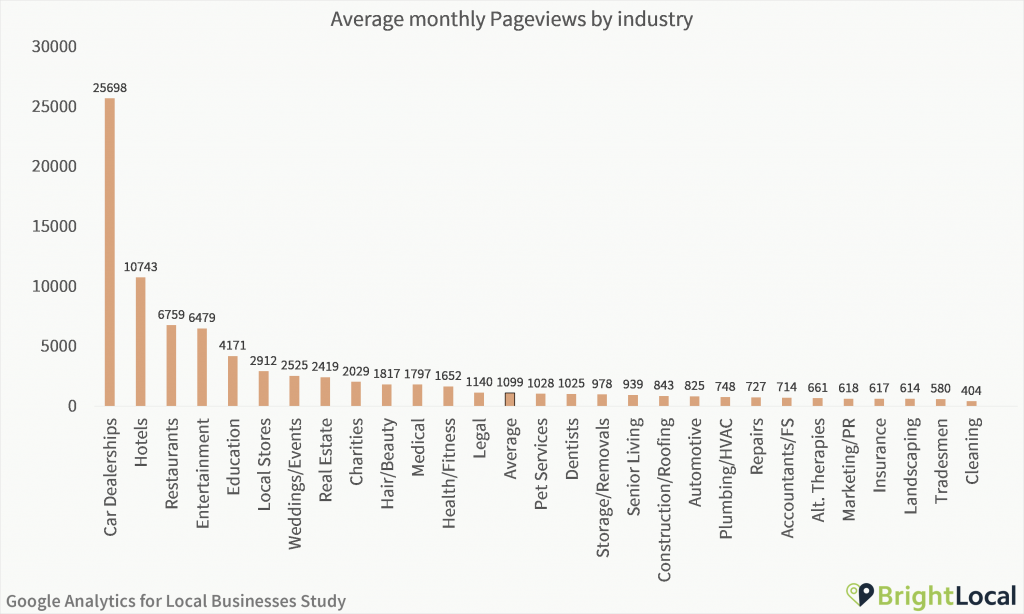
The standout story in the chart above is how many pageviews the average car dealership receives compared to other industries.
As previously mentioned, many car dealerships are part of a chain, and thus share a Google Analytics profile. However, this pageview success could also be attributed to the differences seen in car dealership websites. Customers are highly likely to browse far more pages on a site in search of a new car than they are looking for gardening services, for example. This is further backed up by the trends seen in the pages per session of different industries below.
But, looking beyond the significant lead from dealerships, there are other industries with impressively high numbers of pageviews. If you’re working with hospitality or entertainment businesses, you’ll likely see a high volume of pageviews – in part from higher user counts, but also from their better-than-average pageviews per session.
To boost your pageviews, it’s important to create a journey that keeps people on your site. If there is a great blog or in-depth product details to explore, it’s far more likely you’ll have a high pageview count than if you have just a homepage, about page, and contact page. But, of course, there is no point in keeping people on your site if they aren’t receiving the information they need, so don’t be tempted to create superfluous content solely to inflate this metric.
Grouped average monthly Pageviews
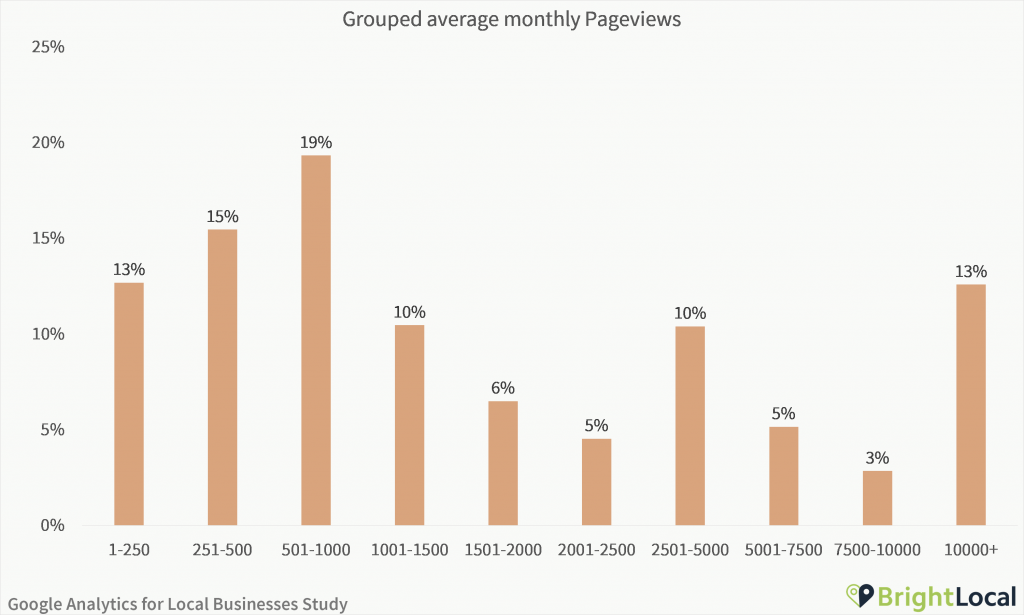
While many local businesses do see high pageviews, there are many reporting far lower counts. 13% of businesses’ websites receive less than 250 pageviews per month, with 28% seeing less than 500.
But this isn’t to say businesses with low average pageview counts aren’t doing well. Many types of businesses don’t require a long conversion journey for their customers – you’re unlikely to have a customer reading 20 blogs on repairs before making a decision! Understand what works for your business and focus on growing traffic that converts. There’s no point optimizing for keywords that will never help your business achieve its goals.
Taking a look at pageview data over time, there was a 4% dip between pageviews in Q4 2017 compared to the same time the next year. Could this be partly down to the growing usage of Google My Business alongside local business websites, and many consumers getting key information they need here instead?
Pages per Session
Pages per session calculates the average number of pages that are viewed by one user during an active session.
Average Pages per Session
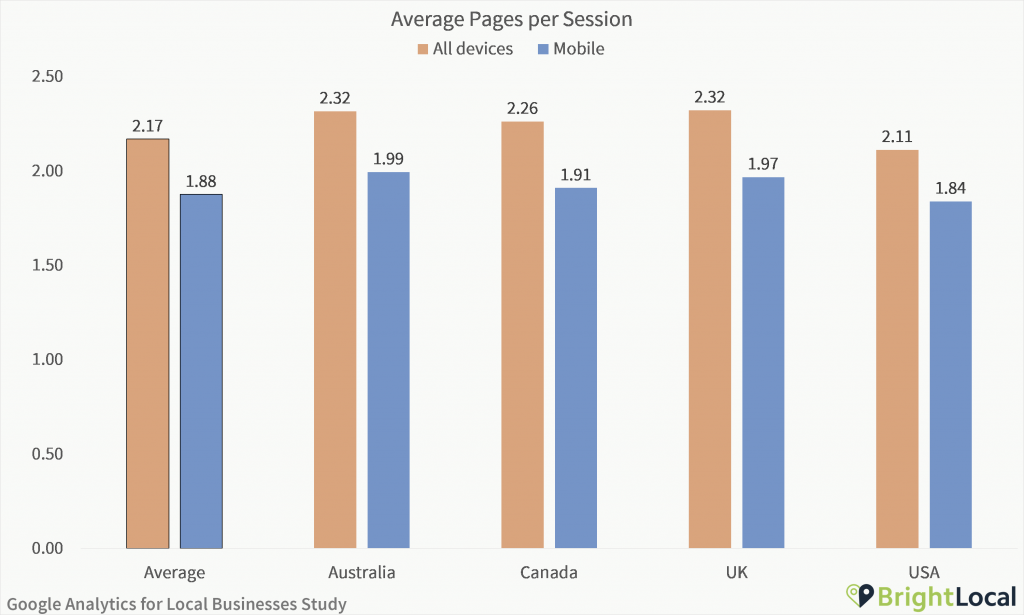
- The average local business website receives 2.17 pages per session across all devices
- Businesses in the UK and Australia receive the highest number of pages per session, while the US receives the least
- Repairs, plumbing, legal, and marketing businesses each receive less than 2 pageviews per session
When analyzing a business’s pages per session data, the median benchmark is 2.17 for all devices, and 1.88 for mobile-only visitors. This means the average business sees 13% lower pageviews per session.
Businesses in the US have the lowest average pages/session, with Australian and UK businesses expecting to see a slightly higher page count in each session. Canadian businesses see the biggest difference in pages per session between mobile and overall data – with a difference of 19%.
Average Pages per Session by industry
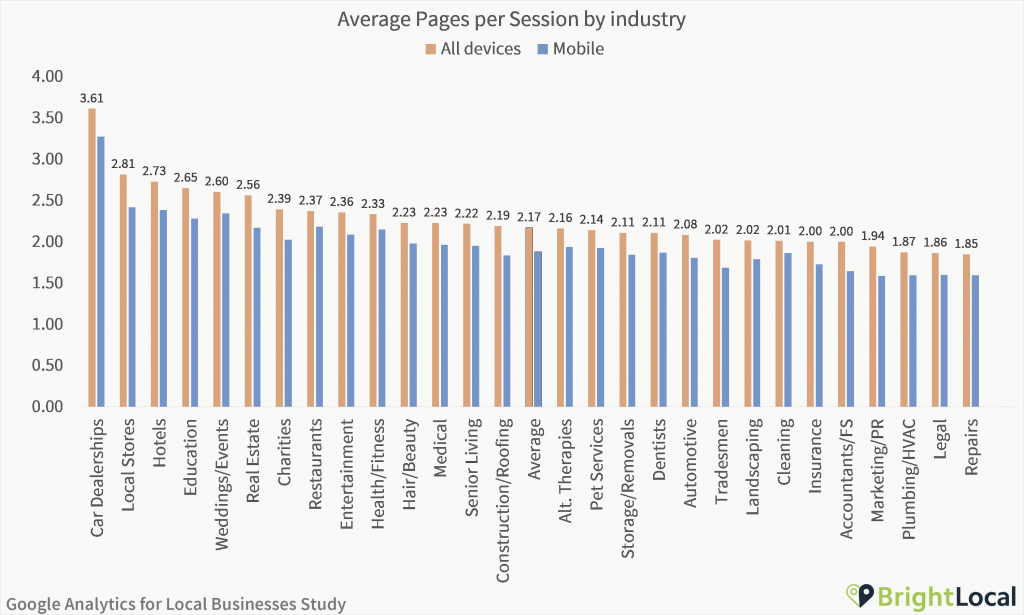
And again, it’s the same industries that are seeing strong performance for this metric in Google Analytics.
Naturally, some industries lend themselves to longer browsing. Local stores are seeing strong performance in this category, likely helped by those that have lots of product information on individual pages on their sites. Websites for hotels also see impressive pages per session, with consumers likely to view pages related to different rooms before making an online booking. Weddings, events, and entertainment businesses also see a higher than average page count per session.
At the other end of the scale, we see repairs, plumbing, and legal businesses averaging less than 2 pages per session. Could this be explained by the glut of information that can be found on Google My Business, limiting the necessity of viewing multiple pages to source this information?
Average Session Duration
The average session duration is calculated by the total duration of all sessions, divided by the number of sessions. Duration is counted between actions, so this does not include the time spent on the final page viewed before leaving the site.
Average Session Duration
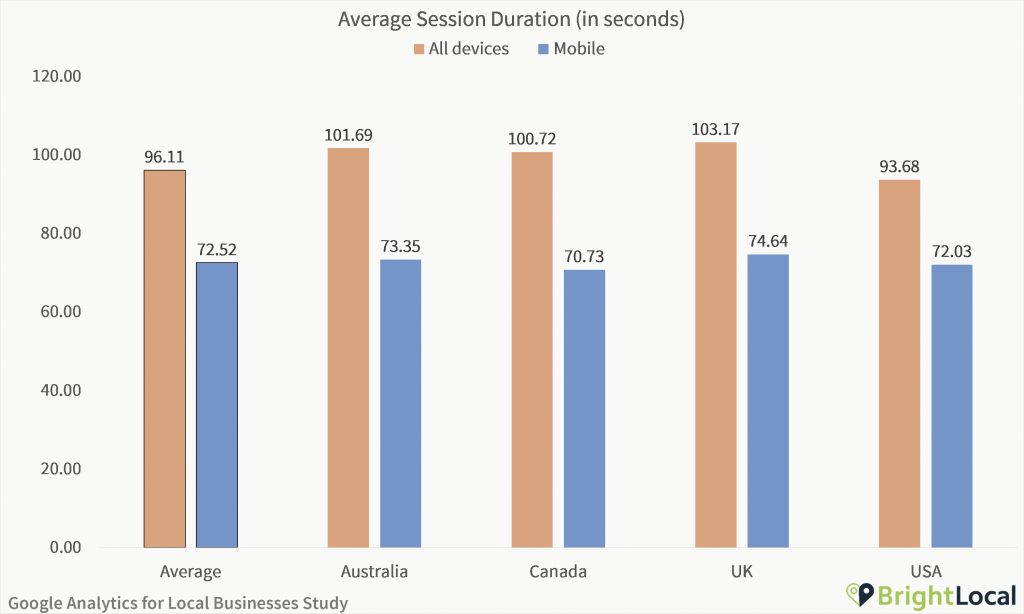
- The average session on a local business’s website is 96 seconds
- Businesses in the UK have the longest average session duration
- Car dealerships, hotels, and stores receive the highest session durations
Local businesses should expect to see an average session duration of 96 seconds. Mobile sessions are an average of 73 seconds, meaning businesses with a high proportion of mobile users may have 31% less time to impress.
American businesses receive a noticeably lower average session duration than their counterparts in the UK, Canada, and Australia. They also see a slightly lower difference in session duration between mobile and all sessions – 28%. For Canadian businesses, this is 42%.
Increasing the time users spend on a website necessitates adding content. Whether this is through blogs, videos to show off your business, or customer testimonials, adding more information is the best way to keep people clicking. But, a high session duration isn’t always indicative of success – as in some cases, users may be struggling to find the information they need.
Average Session Duration by industry
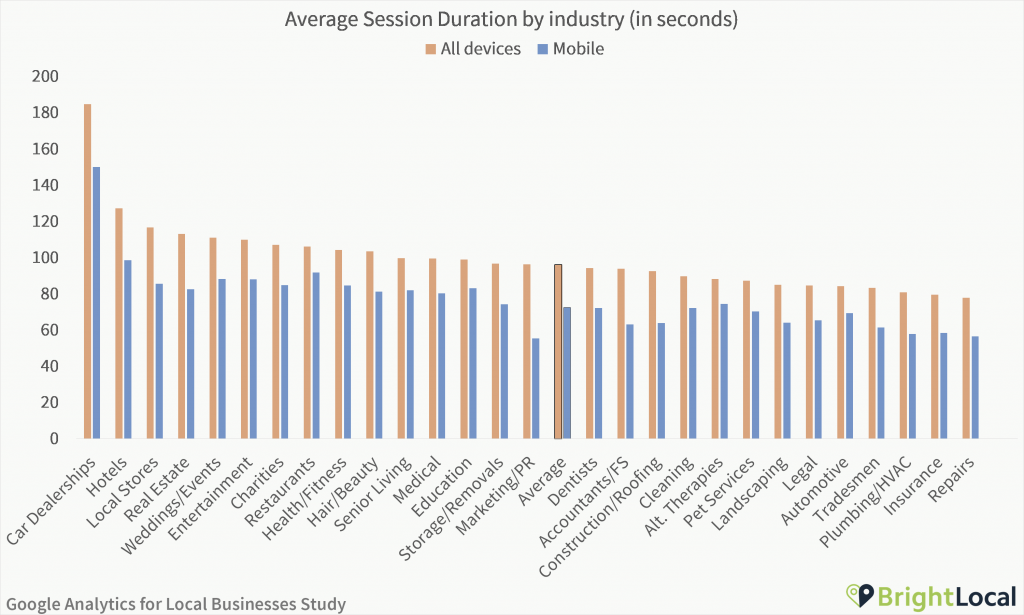
Again, the real story is in the industry breakdown. Consumers are likely to spend a longer time browsing for cars, hotels, retail purchases, and real estate, for example.
When it comes to ‘less fun’ industries such as repairs or plumbing, consumers appear more likely to get in and get out. Consumers for these types of business will likely want to quickly understand the business’s offering, and then contact them, rather than spending a long time trying to find the answers.
In a recent study, we found that 49% of consumers visit local business websites to find contact details – so if you’re in the sort of business that doesn’t require a lot of browsing, make sure your contact details are prominent (and accurate!) For you, session duration is less valuable to focus measurement on.
Bounce Rate
Bounce rate counts the proportion of sessions that only trigger a single Analytics request before leaving the site. These single-page sessions will have a duration of 0 seconds in Google Analytics, though this doesn’t mean a user was on your site for 0 seconds.
Average bounce rate for local businesses
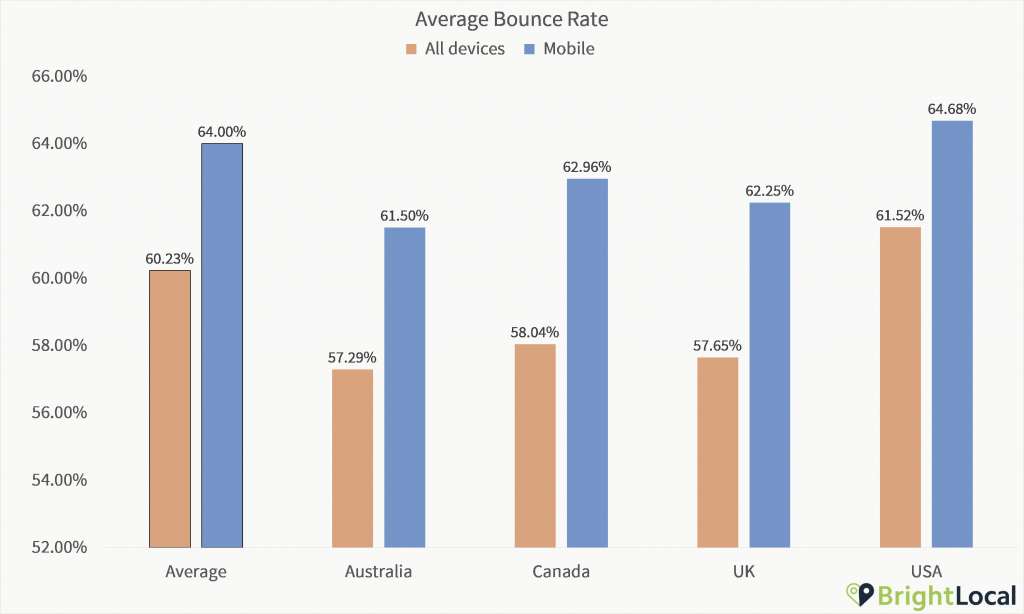
- The average bounce rate for local businesses is 60.23%
- Bounce rate for mobile is higher at 64.00%
- Car dealerships, restaurants, and hotels have the lowest bounce rates, while marketing businesses, repairs, and legal have the highest
Local businesses receive an average bounce rate of close to 60%, while on mobile this is 64%. Many consumers on mobile may be in a different mindset while browsing, and thus looking for different types of information than if they were on a computer.
Likewise, different types of pages will see different expected bounce rates. Blog posts are likely to have high bounce rates, as users will have achieved their goal of reading the blog without having to take another further action or view any extra pages. But, if you have a high bounce rate on your homepage, this could spell trouble.
Year on year, bounce rate increased, seeing a rate of 58.8% in Q4 2017, and 62.8% in the same period in 2018. Meanwhile, mobile bounce rate remained steady. We’d love to hear your theories on this change, so let us know your thoughts in the comments below.
Average Bounce Rate by industry
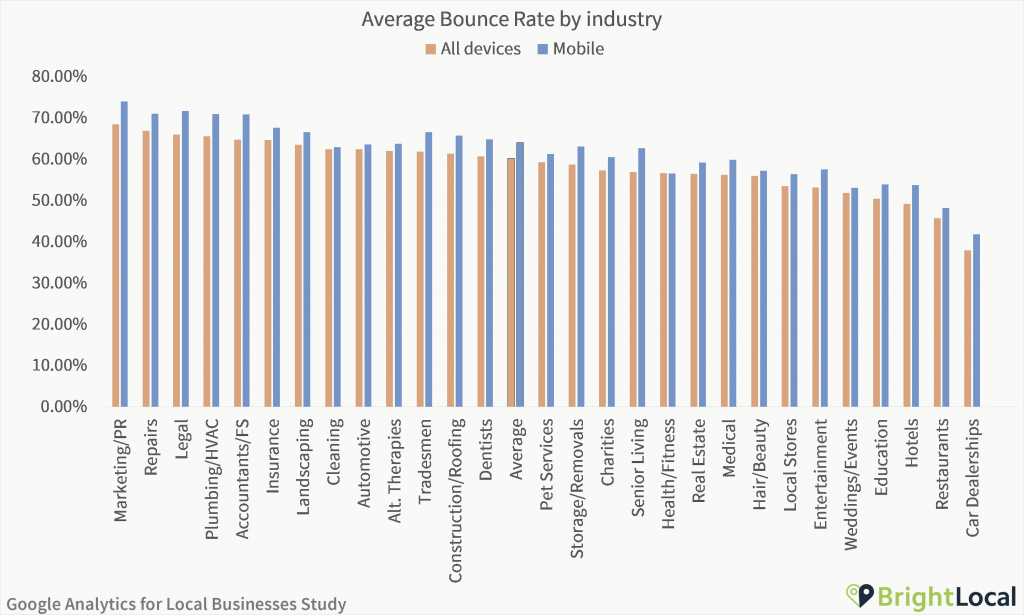
Industries with the highest bounce rates
- Marketing / PR
- Repairs
- Legal
- Plumbing / HVAC
- Accountants / Financial services
Aas you’d expect, the businesses that see a higher than average number of pages per session correlate with those that have lower bounce rates.
Marketing and PR businesses have the highest bounce rates, though this could be affected by this industry’s likelihood to create blogs – which naturally have a high bounce rate.
Other industries with high bounce rates include repairs, legal businesses, plumbers, financial businesses and insurance firms. In all industries, mobile bounce rate is higher than average – though health and fitness-related businesses should expect to see similar rates.
While it’s important to track bounce rate, it’s crucial to be tracking these on each key page. A huge increase in bounce rate to your homepage or pricing page could indicate a real problem that should be urgently addressed. But, if people are navigating to your contact page and then exiting, this would be less of a worry.
But, as a reminder, bounce rate just means that the consumer didn’t complete the next action. Businesses that correctly set up trackable goals within Google Analytics will likely see a decreased bounce rate – not because customers are behaving differently on their site, but just because they have better visibility of the journeys users take.
Goals
In Google Analytics, website owners can set up goals to track user interactions on the website. Types of goals can vary, but can include metrics such as the time spent on the page, CTAs being clicked, form submissions, and more. Goals help website owners understand how users are interacting with their site and measure the conversions that matter to them.
Most commonly set up types of goal
When looking at the most common types of goals that are set up by local businesses, we collated the data and found these to be:
- Contact
- Call
- Form completion
- Booking an appointment
- Thank you pages
The most common types of goal tend to be around how well your web pages perform in helping customers get in touch. Of course, this is critically important for businesses to monitor, and those that haven’t got goals set up may struggle to track how their website leads to interactions. For marketers managing websites for local businesses, setting up relevant goals is a key way to measure the ROI of the website on end conversions.
That being said, goals are not commonplace for most local businesses. 54% of websites reviewed didn’t have any goals set up, making the median number of goals across all websites 0. However, when looking at only those that do have goals, the median number of goals is 2. When looking at the number of conversions, the average local business website that does have goals set up sees just 8 conversions from these per month.
However, the very nature of goals means that it is hard to delete old goals, and thus data may be influenced by goals that the business no longer values or measures against. Of the 16,430 goals we reviewed for this study, 15% had 0 conversions across the whole time period – suggesting that a not insignificant proportion either weren’t set up properly or are simply unachievable.
85% of the businesses saw less than 100 goal conversions each month. Only 6% received more than 500 per month.
Top performing Goal Types by average monthly completions
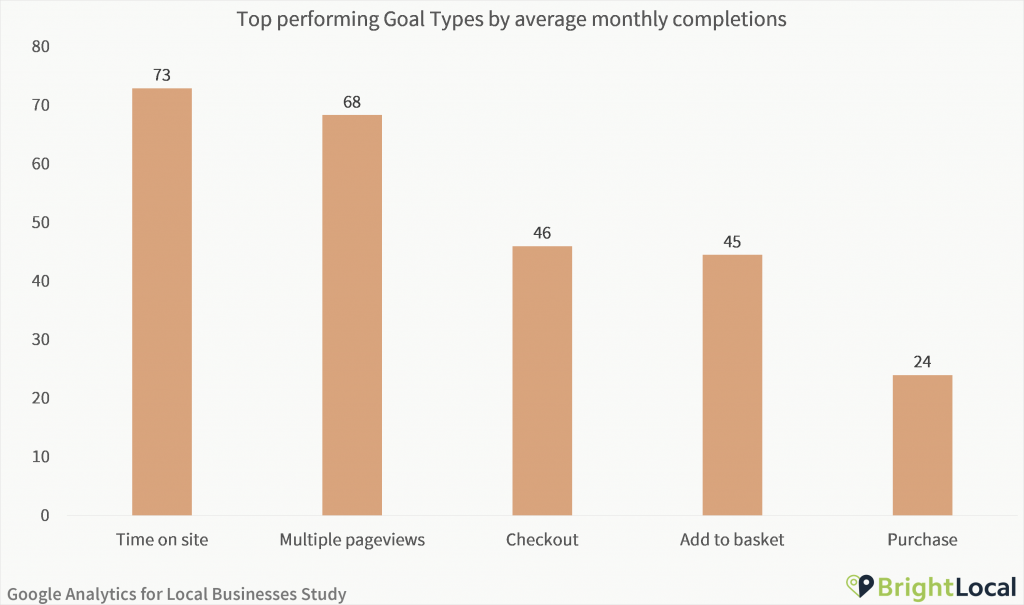
The best performing types of goal
- Time on site
- Multiple pageviews
- Checkout
- Add to basket
- Purchase
We also looked into the different types of goal and how these are being best used by local businesses.
When reviewing the goals, we collated all goals that related to time on page – whether this was one second spent on the page or one hour. We found that time on site is the goal that leads to the highest average goal completions – averaging 73 conversions per month.
Goals related to a user seeing multiple pages also perform well, though this is to be expected. While some may be triggered after seeing more than one page, others may have stricter goals in place waiting for users to view 10 pages or more. But, those that do have this type of goal set up will find it far easier to trigger than goal conversions that are further down the funnel.
Goal conversions related to purchases and bookings are also prevalent. While these can be uncommon features for many local business websites, when they are correctly set up, they lend themselves to relatively high conversions.
But, we can’t assume local businesses are setting their goal values up correctly, given 89% have a goal value of 0. Setting a goal value can help businesses understand their cost per conversion and help them understand which actions and pages driving the most potential revenue for their business.
Industries with the highest goal completions
- Car dealerships (100 per month)
- Hotels (29)
- Medical (14)
- Dentists (8)
- Alternative therapies (8)
As you’d expect from the rest of this report, some industries see better goal performance. This doesn’t necessarily mean that conversions are higher in these industries as a whole, but that these types of industries are more likely to have set up Google Analytics goals. Dealerships and hotels are both industries that appear relatively advanced in their local marketing, so it’s no surprise they’re leading the way here.
Legal, education, and insurance businesses were the only other industries that didn’t have 0. For most industries, average goal completions sit at 0. We chose not to look at businesses segmented by industry with goal completions over 0, as numbers of businesses are too small to draw real conclusions from.
Measurement is a huge opportunity for local businesses looking to better understand and connect with their competitors. Whether it’s through tracking users, bounce rate, the channels your customers are using to find you, or how they’re interacting with your site using goals, it’s vital that local business websites are being tracked over time. To see how BrightLocal can help you understand the performance of yours or your clients’ sites, sign up for a 14-day free trial now.
Full Industry Data
| Industries | Number of businesses | Users | Sessions | Mobile Sessions | Organic | Direct | Referral | Social | Paid | Display | Pageviews | Pages per Session | Mobile Pages per sessions | Average Session Duration | Mobile Average Session Duration | Bounce Rate | Mobile Bounce Rate | Goal Completions | |
|---|---|---|---|---|---|---|---|---|---|---|---|---|---|---|---|---|---|---|---|
| Average | 11016 | 414 | 506 | 184 | 205 | 153 | 40 | 15 | 0 | 0 | 0 | 1099 | 2.17 | 1.88 | 96.1 | 72.5 | 60.23 | 64.00 | 0 |
| USA | 7773 | 404 | 491 | 179 | 194 | 154 | 40 | 15 | 0 | 0 | 0 | 1044 | 2.11 | 1.84 | 93.68 | 72.03 | 61.52 | 64.68 | 0 |
| UK | 1040 | 519 | 644 | 213 | 321 | 162 | 47 | 17 | 0 | 0 | 0 | 1518 | 2.32 | 1.97 | 103.17 | 74.64 | 57.65 | 62.25 | 1 |
| Australia | 1084 | 375 | 468 | 199 | 195 | 126 | 29 | 11 | 0 | 0 | 0 | 1076 | 2.32 | 1.99 | 101.69 | 73.36 | 57.29 | 61.50 | 5 |
| Canada | 1119 | 462 | 566 | 196 | 226 | 164 | 35 | 13 | 0 | 0 | 0 | 1220 | 2.26 | 1.91 | 100.72 | 70.73 | 58.04 | 62.96 | 0 |
| YOY Change: Q4 2017 - Q4 2018 | x | 2% | -2% | -3% | -10% | 0% | 157% | 20% | 0% | 0% | 0% | -4% | -6% | -1% | -5% | -3% | 7% | 0% | 0% |
| Accountants/FS | 253 | 296 | 363 | 96 | 133 | 128 | 43 | 11 | 0 | 0 | 0 | 714 | 2.00 | 1.65 | 93.83 | 63.20 | 64.69 | 70.84 | 0 |
| Alt. Therapies | 643 | 243 | 308 | 141 | 134 | 113 | 19 | 13 | 0 | 0 | 0 | 661 | 2.16 | 1.94 | 88.28 | 74.47 | 61.99 | 63.77 | 10 |
| Automotive | 331 | 310 | 372 | 159 | 164 | 106 | 34 | 8 | 0 | 0 | 0 | 825 | 2.08 | 1.81 | 84.23 | 69.30 | 62.38 | 63.56 | 0 |
| Car Dealerships | 209 | 4846 | 7602 | 3782 | 2532 | 1399 | 374 | 164 | 0 | 837 | 27 | 25698 | 3.61 | 3.27 | 184.85 | 150.03 | 37.94 | 41.82 | 100 |
| Charities | 113 | 733 | 917 | 226 | 300 | 284 | 57 | 31 | 0 | 0 | 0 | 2029 | 2.39 | 2.02 | 107.08 | 84.76 | 57.29 | 60.48 | 0 |
| Cleaning | 414 | 163 | 192 | 65 | 66 | 69 | 27 | 7 | 0 | 0 | 0 | 404 | 2.01 | 1.86 | 89.65 | 72.21 | 62.41 | 62.89 | 0 |
| Construction/Roofing | 780 | 319 | 380 | 122 | 154 | 122 | 32 | 10 | 0 | 0 | 0 | 843 | 2.19 | 1.84 | 92.48 | 63.87 | 61.32 | 65.75 | 0 |
| Dentists | 765 | 389 | 478 | 219 | 205 | 133 | 30 | 12 | 0 | 0 | 0 | 1025 | 2.11 | 1.87 | 94.34 | 72.16 | 60.66 | 64.85 | 8 |
| Education | 204 | 1086 | 1524 | 634 | 750 | 381 | 73 | 44 | 0 | 3 | 0 | 4171 | 2.65 | 2.28 | 123.14 | 98.85 | 50.39 | 53.91 | 1 |
| Entertainment | 162 | 2015 | 2779 | 1393 | 1080 | 665 | 139 | 91 | 0 | 7 | 0 | 6479 | 2.36 | 2.08 | 109.85 | 88.13 | 53.17 | 57.50 | 0 |
| Weddings/Events | 120 | 729 | 954 | 443 | 446 | 232 | 59 | 44 | 0 | 2 | 0 | 2525 | 2.60 | 2.34 | 110.96 | 88.14 | 51.83 | 53.08 | 0 |
| Hair/Beauty | 296 | 658 | 819 | 382 | 384 | 214 | 53 | 36 | 0 | 0 | 0 | 1817 | 2.23 | 1.98 | 103.57 | 81.24 | 55.94 | 57.20 | 0 |
| Health/Fitness | 267 | 559 | 739 | 365 | 358 | 241 | 46 | 31 | 0 | 0 | 0 | 1652 | 2.33 | 2.15 | 104.20 | 84.58 | 56.64 | 56.51 | 0 |
| Hotels | 144 | 3423 | 4166 | 1775 | 1912 | 943 | 289 | 91 | 0 | 90 | 0 | 10743 | 2.73 | 2.38 | 127.34 | 98.68 | 49.14 | 53.71 | 29 |
| Insurance | 164 | 276 | 321 | 91 | 111 | 113 | 32 | 7 | 0 | 0 | 0 | 617 | 2.00 | 1.73 | 79.49 | 58.37 | 64.67 | 67.64 | 3 |
| Landscaping | 191 | 254 | 307 | 94 | 116 | 98 | 30 | 9 | 0 | 0 | 0 | 614 | 2.02 | 1.79 | 85.09 | 64.02 | 63.52 | 66.54 | 0 |
| Legal | 550 | 463 | 559 | 189 | 255 | 152 | 44 | 10 | 0 | 0 | 0 | 1140 | 1.86 | 1.60 | 84.63 | 65.47 | 65.97 | 71.65 | 1 |
| Local Stores | 635 | 859 | 1038 | 437 | 460 | 265 | 58 | 35 | 0 | 0 | 0 | 2912 | 2.81 | 2.42 | 116.73 | 85.64 | 53.44 | 56.37 | 0 |
| Marketing/PR | 718 | 243 | 298 | 52 | 78 | 135 | 46 | 13 | 0 | 0 | 0 | 618 | 1.94 | 1.59 | 96.35 | 55.37 | 68.43 | 73.97 | 0 |
| Medical | 538 | 626 | 779 | 337 | 395 | 192 | 48 | 21 | 0 | 0 | 0 | 1797 | 2.23 | 1.96 | 99.62 | 80.25 | 56.18 | 59.85 | 15 |
| Pet Services | 181 | 420 | 504 | 252 | 211 | 135 | 39 | 17 | 0 | 1 | 0 | 1028 | 2.14 | 1.92 | 87.21 | 70.28 | 59.23 | 61.21 | 0 |
| Plumbing/HVAC | 338 | 293 | 368 | 120 | 130 | 109 | 34 | 10 | 0 | 0 | 0 | 748 | 1.87 | 1.59 | 80.88 | 57.96 | 65.51 | 70.91 | 0 |
| Real Estate | 384 | 705 | 955 | 468 | 390 | 203 | 42 | 25 | 0 | 0 | 0 | 2419 | 2.56 | 2.17 | 113.14 | 82.613 | 56.45 | 59.14 | 0 |
| Repairs | 186 | 313 | 376 | 132 | 151 | 117 | 34 | 10 | 0 | 0 | 0 | 727 | 1.85 | 1.59 | 77.84 | 56.53 | 66.86 | 71.04 | 0 |
| Restaurants | 184 | 2383 | 2986 | 1726 | 1389 | 878 | 83 | 97 | 0 | 0 | 0 | 6759 | 2.37 | 2.18 | 106.19 | 91.87 | 45.66 | 48.18 | 0 |
| Senior Living | 178 | 354 | 417 | 159 | 212 | 113 | 36 | 9 | 0 | 0 | 0 | 939 | 2.22 | 1.95 | 99.75 | 81.93 | 56.85 | 62.64 | 0 |
| Storage/Removals | 214 | 375 | 458 | 172 | 192 | 133 | 35 | 9 | 0 | 0 | 0 | 978 | 2.11 | 1.84 | 96.81 | 74.27 | 58.66 | 63.07 | 0 |
| Tradesmen | 538 | 251 | 296 | 108 | 109 | 88 | 29 | 7 | 0 | 0 | 0 | 580 | 2.02 | 1.69 | 83.35 | 61.50 | 61.82 | 66.56 | 0 |
Methodology
In this study, we explored anonymous data of 11,016 local businesses in the USA, Canada, Australia, and the UK.
To do this, we reviewed data from a random sample of Google Analytics data between September 2017 and December 2018. Businesses did not necessarily have data for every month in the timeframe and businesses that did not have active Google Analytics data have been removed where relevant. Data was collected from an anonymous sample of BrightLocal users that opted in with active connections to Google Analytics.
Where relevant, we have included data split by 26 key industries. Data also contains businesses from outside these industries, but when grouped, equated to small numbers. This meant industries including bars and photographers not having sufficient business to draw conclusions for the whole industry.
It’s important to remember that not every local business will have signed up for Analytics, so the data is, of course, only looking into the websites of Google Analytics users. Data is collected from anonymous BrightLocal users, who may be a little more digitally-savvy than the average local business. While we are focusing this study on the GA profiles of local businesses, some of these will naturally be part of multi-location chains that have multiple businesses represented by one Google Analytics profile. To address this, we’ve provided the median as well as information on the proportions of businesses with significantly higher than average results in some cases.
In line with BrightLocal’s main customer-base, the dataset is based on businesses from the US, Canada, Australia, and the UK. This included 7,773 businesses in the US, 1,040 in the UK, 1,084 in Australia, and 1,119 in Canada.
For more information on this study, or for any questions you may have about the findings of the Google Analytics for Local Business Study, please get in touch at content@brightlocal.com. Publishers are welcome to use charts and statistics crediting BrightLocal and linking to the report.
How do your Google Analytics results stack up against businesses in your location and industry? Let us know in the comments below!