


Key Findings
-
The Google My Business Insights Study explores 45,000 anonymous listings across 36 industries to help local businesses benchmark their Insights against the wider industry
-
The average business is found in 1,009 searches per month, with 84% of these coming from discovery searches
-
49% of businesses receive more than 1,000 Views on Search per month
-
Car dealerships receive the highest number of calls and website visits from GMB, while hotels have the highest views on Search and Maps
-
5% of Google My Business listing views result in a website click, call, or direction request
-
Local businesses have a median of 11 photos on Google My Business
-
Between Q4 2017 and Q4 2018, direct searches grew by 38%, while website clicks from GMB listings grew 29%
Google My Business Insights is one of the most useful tools in a local marketer’s arsenal, but it comes with its own set of challenges. With little out there to guide local marketers on what Google My Business success looks like, we set out to uncover what the typical business should see in their GMB Insights.
To do this, we explored the listings of 45,000 anonymous local businesses to provide an in-depth benchmark to help GMB users understand how their results stack up. Through analysis of such a large sample, we hope the data below helps local businesses to understand their own results against the median business, as well as helping to highlight the areas of improvement that could lead to further successes from online marketing efforts.
We enlisted the help of local marketing experts Ben Fisher and Claire Carlile to provide additional insights throughout – a huge thank you for sharing your wisdom with us!
If you have any additional thoughts or comments on the findings of the Google My Business Insights Study, please leave a comment below, or contact us with any questions. Find out more information on BrightLocal’s Google Business Profile Audit (formerly ‘Google My Business Audit’) with a 14-day free trial.
Contents
- How Customers Search for Your Business
- Where Customers View Your Business On Google
- Common Actions Customers Take On Listings
- Conversion Rates from Views to Actions
- Phone Calls: Day of the Week and Time of Day
- Photo Quantity
- YOY Growth in Views, Actions, and Searches
- Industry Data and Downloads
- Methodology
Why are Google My Business Insights Important?
GMB is a critical tool for local businesses wanting to rank in local searches, but the reliability of Google My Business Insights is frequently debated.
Ben Fisher, Google My Business Gold Product Expert and co-founder of Steady Demand, shared his thoughts on the importance of GMB Insights:
Google My Business Insights are far from perfect. As with any tool, these are merely a benchmark that points you in a direction. GMB Insights, in particular, are not very accurate, and can sometimes suffer from data outages. However, they can give you an indication as to how you are doing. Although not covered in this study, keyword queries are very valuable as they can show you what keywords you are displaying for.”
Claire Carlile said,
GMB insights are incredibly important for local businesses. They should use them to benchmark performance and revisit regularly in order to help them judge the efficacy of their local marketing efforts. However, interpretation of GMB insights can prove tricky and it’s important that businesses don’t expect parity between GMB Insights and other Google data that’s available to them (for example via Google Search Console and Google Analytics). GMB insights data is just part of the data puzzle that businesses need to consider in order to make informed business decisions.”
How Customers Search for Your Business
In Google My Business, local businesses can find out the types of search that customers use to find their listings. For this study, we explored how many direct and discovery searches the average business receives, as well as how this differs by industry, country, and over time.
Direct search
A customer directly searched for your business name or address.
Discovery search
A customer searched for a category, product, or service that you offer, and your listing appeared.
To note, we did not explore Branded searches in this study due to these being introduced to GMB partway through the collection of the dataset.
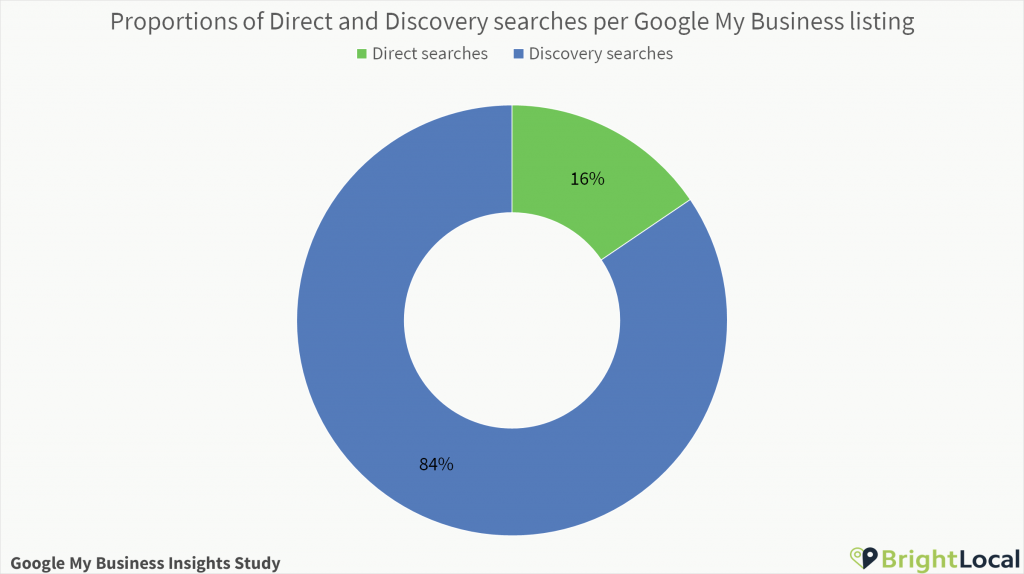
Proportions of Direct and Discovery searches per Google My Business listing
Key Findings
- The average business is found in 157 direct searches each month, and 852 discovery searches. This totals an average of 1,009 searches per month
- 84% of searches are discovery, while 16% are direct
- Businesses in the UK see the highest proportion of direct searches
- 34% of local businesses are seen in more than 1,000 discovery searches per month
- Car dealerships receive the most direct searches each month, while hotels have the highest discovery searches per month
- Discovery searches grew 6% between Q4 2017 and Q4 2018, while Direct searches grew 38%
Average Monthly Direct and Discovery searches per Google My Business listing
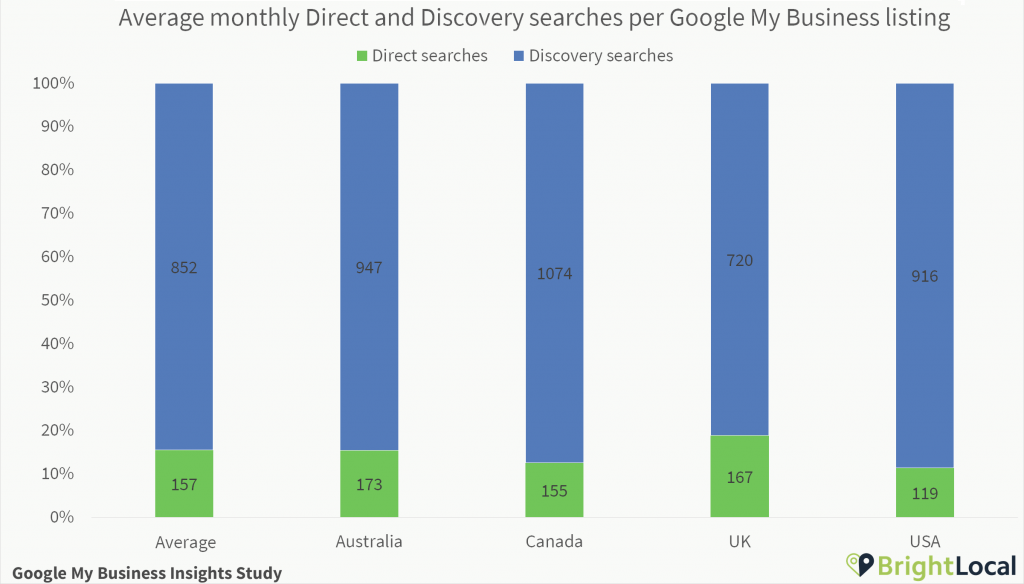
The average business receives 1,009 customer searches each month, with 84% of these coming from discovery searches, and the remaining 16% from direct.
Looking across countries, businesses in the USA receive 11% of views through direct searches – with a total average search volume of 1,035. In the UK, 19% of searches are direct, though this equates to fewer searches overall (887). Canada receives the highest number of average direct and discovery searches (1,229), at a rate of 13% direct to 87% discovery.
Grouped Average Monthly Direct and Discovery searches per Google My Business listing
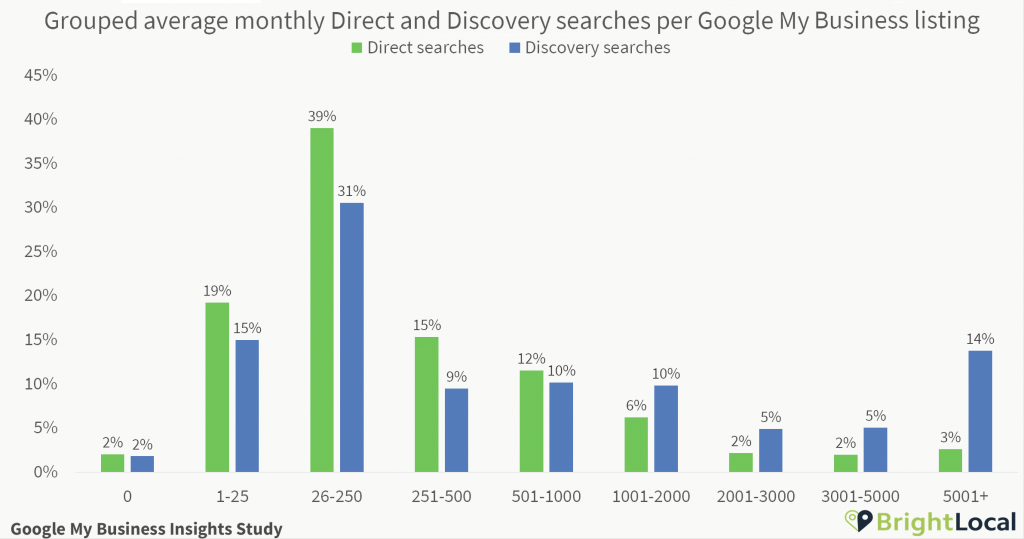
However, viewing the median for all local businesses doesn’t tell the whole story. 83% of businesses get seen in discovery searches more than 25 times per month, while 34% are seen more than 1,000 times!
Of course, customers making discovery searches may have a lower intent to buy than those making direct searches, with multiple businesses competing for the attention of the searcher following a discovery search.
To maximize their chances, businesses should aim to reach the top positions in local searches, as well as growing the number of positive reviews.
Our Local Services Ads Click Study found that the local pack receives 32% of clicks in SERPs without Local Services Ads. Within this, respondents that clicked on local searches were most likely to do so because of review ratings, the number of reviews, and the position in results.
While a far smaller piece of the pie, direct searches are important to local businesses as they indicate the searcher is already aware of the business by experience or reputation. 79% of businesses receive more than 25 direct searches per month. 13% receive more than 1,000 – though this is likely to be chains or incredibly popular local businesses, so don’t feel too bad if your Insights don’t match up!
Direct searches are difficult to achieve, but businesses with a significant number of these should make sure their Google My Business listing is as filled out as possible in to answer all the questions searchers may have about your brand that helps them make a final decision.
| Direct | Discovery | Highest Direct Rate | Highest Discovery Rate |
|---|---|---|---|
| 1. Car dealerships (2053) | 1. Hotels (8480) | 1. Senior living (32%) | 1. Locksmiths (97%) |
| 2. Hotels (2011) | 2. Restaurants (5570) | 2. Car dealerships (29%) | 2. Repairs (96%) |
| 3. Restaurants (701) | 3. Car dealerships (5062) | 3. Business services (28%) | 3. Legal (92%) |
| 4. Senior living (508) | 4. Repairs (2300) | 4. Funeral services (25%) | 4. Storage and removals (92%) |
| 5. Bars (470) | 5. Bars (2190) | 5. Pet services (19%) | 5. Tradesmen (92%) |
| 6. Tourism and entertainment (463) | 6. Health and Fitness (2053) | 6. Hotels (19%) | 6. Marketing / PR (91%) |
| 7. Health and fitness (405) | 7. Tourism (1981) | 7. Tourism and entertainment (19%) | 7. Accountants and financial services (91%) |
| 8. Pet services (316) | 8. Automotive (1948) | 8. Catering (18%) | 8. Photographers (90%) |
| 9. Hair and beauty (292) | 9. Hair and beauty (1902) | 9. Bars (18%) | 9. Plumbing and HVAC (90%) |
| 10. Automotive (255) | 10. Local stores (1757) | 10. Health and fitness (16%) | 10. Local stores (89%) |
For more information on differences in Google My Business Insights between industries, download the full data below.
There are notable differences between industries, as you might expect. Businesses that are infrequently used tend to be those with the highest discovery rates, including locksmiths, repairs, and legal services.
Each of these three business types are likely to be needed quickly in emergencies, so it’s likely they receive many leads from people in need who don’t have lots of time to shop around!
Industries with the highest direct rates appear to be businesses that require a little more research, as well as recommendations from friends and family.
Average Monthly Direct and Discovery searches per Google My Business listing
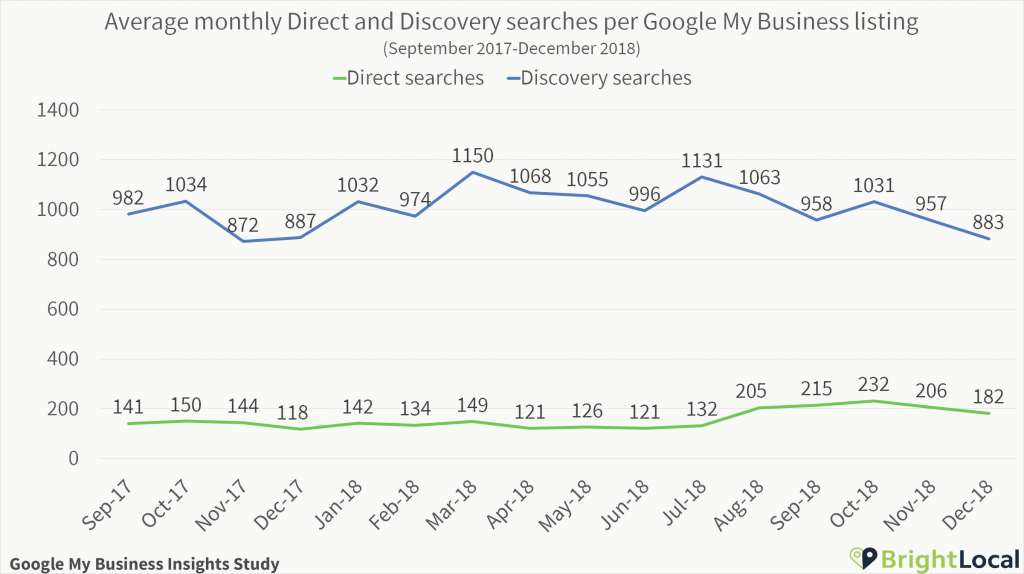
Comparing monthly medians over time presents some interesting trends. Both Direct and Discovery searches slow down in Q4, likely due to the holiday season.
Direct searches saw significant growth in August 2018. This jump could potentially be attributed to a change in mid-August that saw Google My Business beginning to report on queries about businesses.
When comparing Q4 in 2017 and 2018, both saw growth. Discovery searches grew by 6% year-on-year, while Direct searches grew by a significant 38%. This could be due to the change mentioned above, or it could suggest that searchers are shifting their behavior to find information about businesses they already know on a regular basis using GMB.
Our research into consumers’ use of Google My Business and local business websites found that 64% have used GMB to find contact details for a local business – and this figure is likely to grow.
Read more on annual growth here.
Where Customers View Your Business on Google
This section of Google My Business Insights explores where searchers are viewing the business’s Google My Business listing.
Views on Search
A customer found the business via Google Search, including local pack results from search.
Views on Maps
A customer found the business via Google Maps.
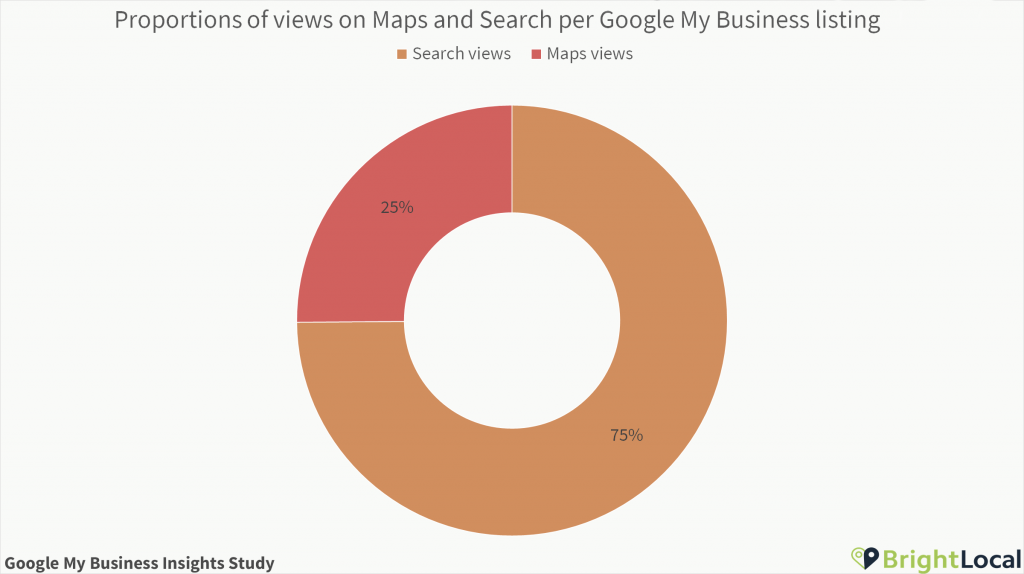
Proportion of views on Maps and Search per Google My Business listing
Key Findings
- The average local business receives 1,260 views each month – 943 on Search and 317 on Maps
- 75% of businesses’ GMB listing views are on Search
- 49% of businesses receive more than 1,000 Views on Search per month
- Businesses in Canada have the highest average monthly Views on Search
- Hotels have the highest number of views on both Search and Maps each month
- Views on Search grew 7% in Q4 2018
Average Monthly Views on Search and Maps Per Google My Business Listing
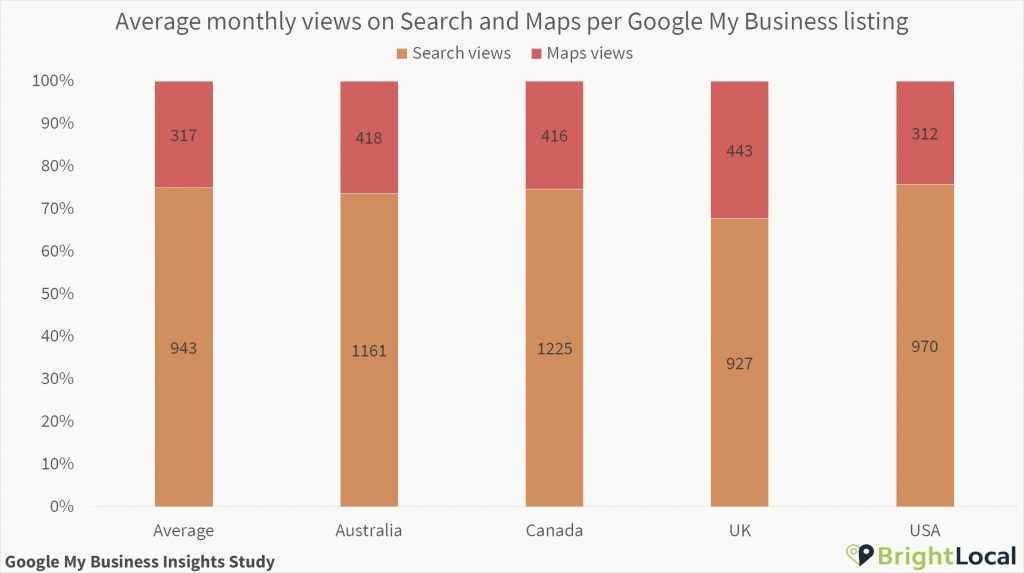
On average, businesses receive 943 Search views and 317 Maps views each month.
Businesses in the UK have the highest proportion of Maps views (32%), which could be linked to the higher proportion of direct searches, as seen above. In comparison, businesses in the USA receive 26% of their views from Maps results.
Canadian businesses have the highest average views overall, with 1,225 Search views and 416 Maps views each month. If you have any thoughts on why trends may differ between countries, let us know in the comments.
Whether customers are finding businesses using Search or Maps, the top ranking results are highly likely to receive the most conversions. Great photos and high review ratings could be the differentiators that makes a customer choose one business over its competitors.
Grouped Average Monthly Views on Search and Maps Per Google My Business Listing
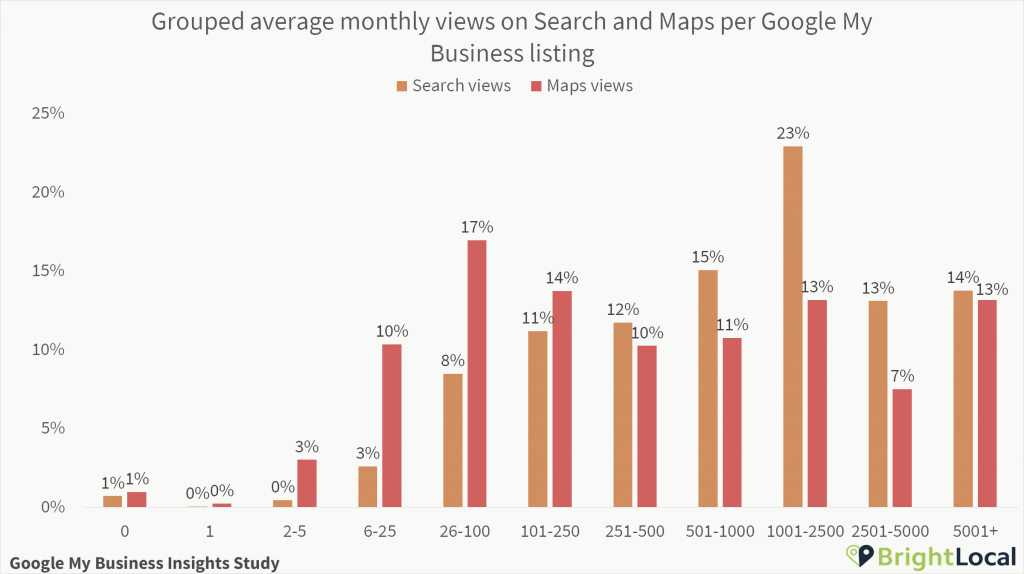
Google My Business is clearly a critical channel, with 96% of local businesses being viewed at least 25 times per month in Search results, and 86% receiving more than 25 in Maps.
And there’s plenty of space for high numbers, with 49% of businesses receiving more than 1,000 average Search views per month, and 33% receiving 1,000+ on Maps.
Of course, a view does not mean that a local business went on to convert a customer. There’s huge potential in GMB, and the businesses that rank highly in local results are likely to see the most value from their listings. To monitor your own local rankings, audit your Google My Business listing, and grow your reviews, sign up for a 2-week free BrightLocal trial.
| Search Views | Maps Views | Search Rate % | Maps Rate % |
|---|---|---|---|
| 1. Hotels (13,042) | 1. Hotels (14,434) | 1. Photographers (88%) | 1. Senior living (67%) |
| 2. Car dealerships (7,740) | 2. Restaurants (5,439) | 2. Landscapers / Gardeners (88%) | 2. Hotels (53%) |
| 3. Restaurants (6,386) | 3. Car dealerships (4,877) | 3. Tradesmen (87%) | 3. Bars (48%) |
| 4. Tourism and entertainment (2,619) | 4. Senior living (3,095) | 4. Legal (86%) | 4. Funeral services (47%) |
| 5. Bars (2,484) | 5. Bars (2,269) | 5. Repairs (85%) | 5. Restaurants (46%) |
| 6. Health and fitness (2,427) | 6. Tourism and entertainment (2,224) | 6. Plumbing and HVAC (84%) | 6. Tourism and entertainment (46%) |
| 7. Hair and beauty (2,262) | 7. Automotive (1,890) | 7. Locksmiths (84%) | 7. Automotive (46%) |
| 8. Automotive (2,228) | 8. Health and fitness (1,317) | 8. Cleaning (84%) | 8. Car dealerships (39%) |
| 9. Repairs (2,086) | 9. Local stores (1,108) | 9. Construction / Roofing (84%) | 9. Education (38%) |
| 10. Local stores (2,018) | 10. Pet services (916) | 10. Weddings and events | 10. Pet services (37%) |
For more information on differences in Google My Business Insights between industries, download the full data below.
Hotels are leading the way in monthly views. The average hotel receives 47% of their views from Search and 53% from Maps, while restaurants receive 54% of views from Search and 46% from Maps. Bars receive a similarly even split, with 52% of views coming from Search.
Most other industry types seem to be swayed towards Views on Search, so it’s highly likely that hospitality businesses are benefiting from the increased frequency of people visiting these using directions, as well as the alternative functions they can have on Maps.
And, as you’d expect, service-area businesses such as photographers, landscapers, and tradesmen receive a far smaller proportion of views via Maps.
Average monthly views on Search and Maps per Google My Business listing
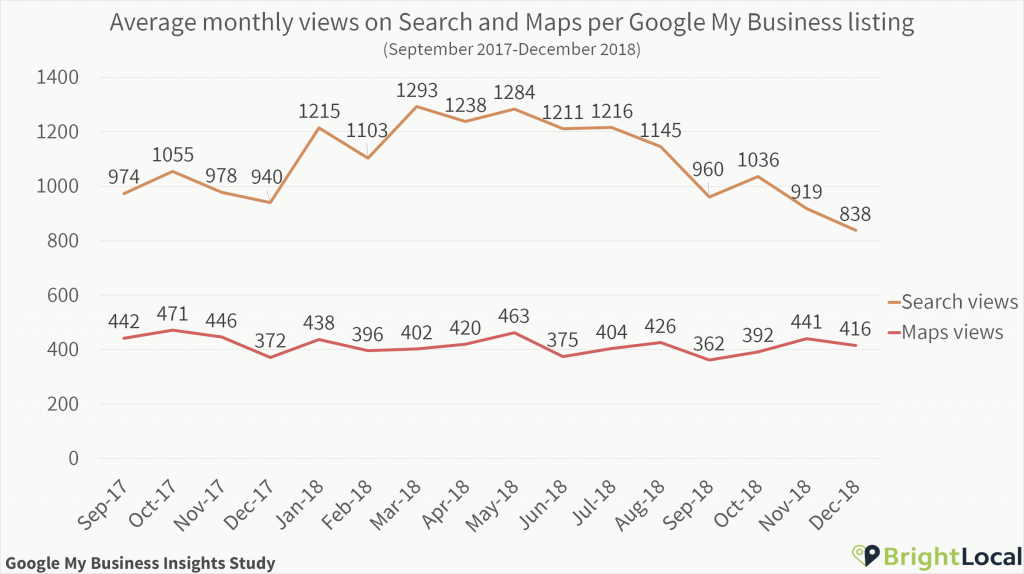
Looking over the timeframe, there has been a dip in median Search views per month since August 2018. While some of this can be attributed to seasonality, it does seem that average monthly views slightly slipped at the end of 2018 compared to the previous year. But, with more businesses setting up Google My Business listings by the day, it could be that more businesses are battling for top positions, leaving those falling into the lower positions with fewer views.
Between Q4 2017 and Q4 2018, there was a drop of 7% views on Search. Median Maps views, on the other hand, grew by 4%, and remained fairly static throughout the time period.
Read more on annual growth here.
Google My Business Management 101
The Most Common Actions Customers Take on Listings
While views and searches are incredibly important, the real value for local businesses (and where marketers can most easily demonstrate their value!) is from the actions customers take after viewing a business on Google.
Visit your website
A customer views the business’s website.
Request directions
A customer requests directions to the business.
Call you
A customer clicks on the listing to call the business.
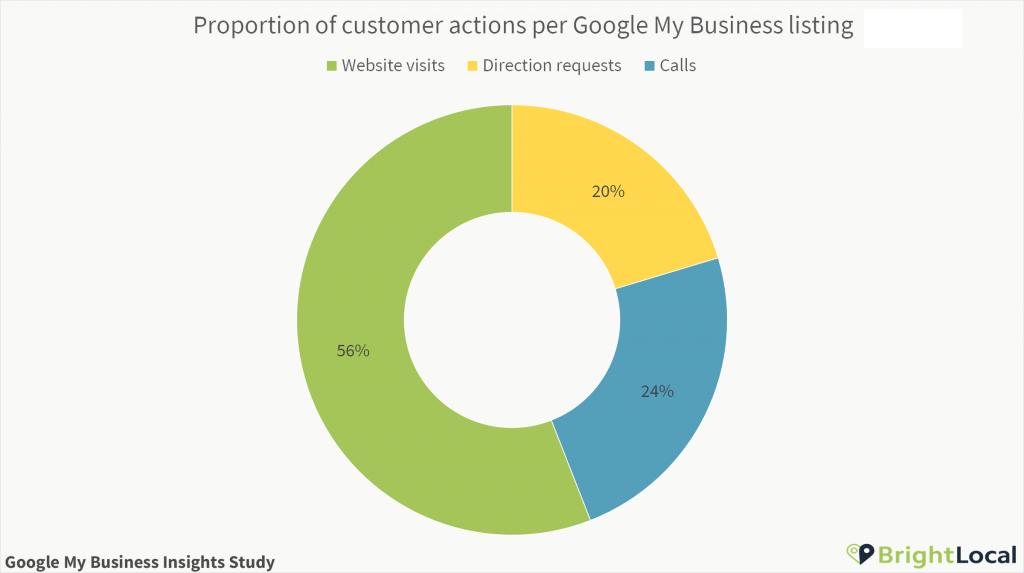
Proportion of customer actions per Google My Business listing
Key Findings
- A typical business receives 59 actions from their Google My Business listing each month
- On average, 56% of actions on GMB listings are website visits
- 16% of businesses receive more than 100 calls each month from GMB
- Only 5% of views result in an action. This grew between 2017 and 2018
- Car dealerships receive the highest number of calls and website visits from GMB
- Calls from GMB grew 22% between Q4 2017 and Q4 2018
Average monthly customer actions per Google My Business listing
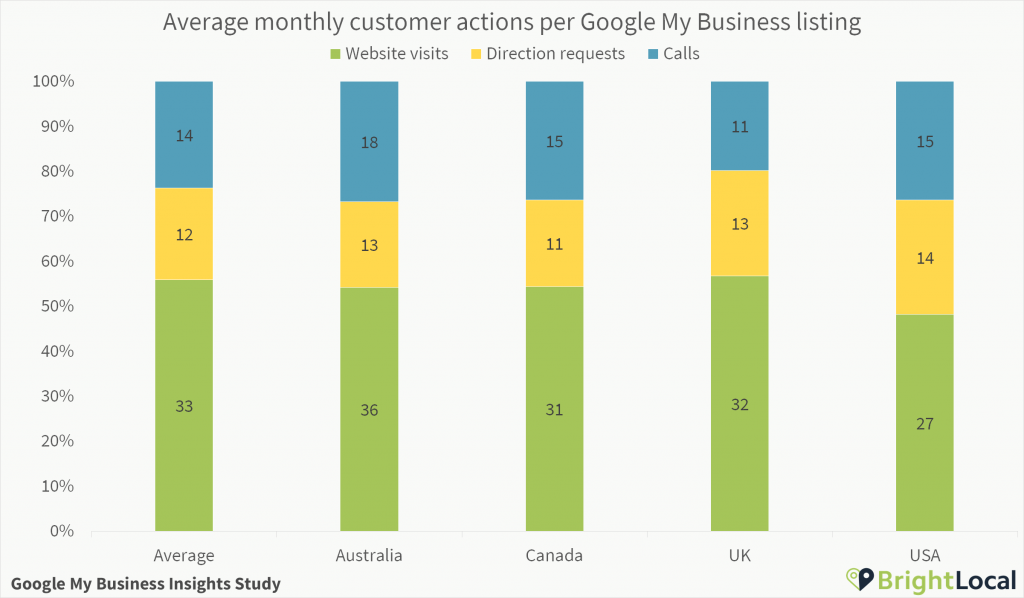
In every one of the four countries analyzed in this study, website visits were the most frequent actions from GMB. The average business receives 33 clicks each month from their GMB listing, with 59 actions overall.
Australian businesses have the highest number of average website clicks (36), as well as the highest number of calls (18). In fact, Australian businesses have the highest monthly actions, with a median of 67. In the US, direction requests are important, with a median of 14 per business.
In a recent survey, we found that 64% of consumers have used Google My Business listings to find a local business’s address or phone number. GMB is clearly a critical channel for customers contacting or visiting a business, though it’s important to remember this doesn’t take into account untrackable actions, such as customers looking up the business and going to visit without directions, or calling without clicking through from GMB. Adding call tracking to numbers on Google My Business can help you learn how much value the GMB listing is having beyond what is reported in Insights.
Likewise, direction requests aren’t split between new and existing customers. Each unique user requesting directions will only be counted once in a time period, but businesses that may see lots of people using sat navs to get to (such as tourist attractions), may see more directions requests than the norm.
According to Moz’s 2018 Local Search Ranking Factors survey, call and direction requests are a ranking factor, as is the clickthrough rate from search results.
It remains incredibly important to maintain both a presence on Google My Business and a useful and accurate website for local businesses. Only 8% of consumers never look at websites when choosing a local business, and 38% of consumers recall visiting a website from the business’s GMB listing.
There are plenty of opportunities for businesses to improve their own actions. Ben Fisher says,
I am not surprised to see a higher clickthrough to the website. I would attribute this to more profiles being filled out completely. Google even states that a business profile that is complete will get on average 7x more clicks than empty ones.”
The Smarter Way to Manage Listings
Grouped average monthly customer actions per Google My Business listing
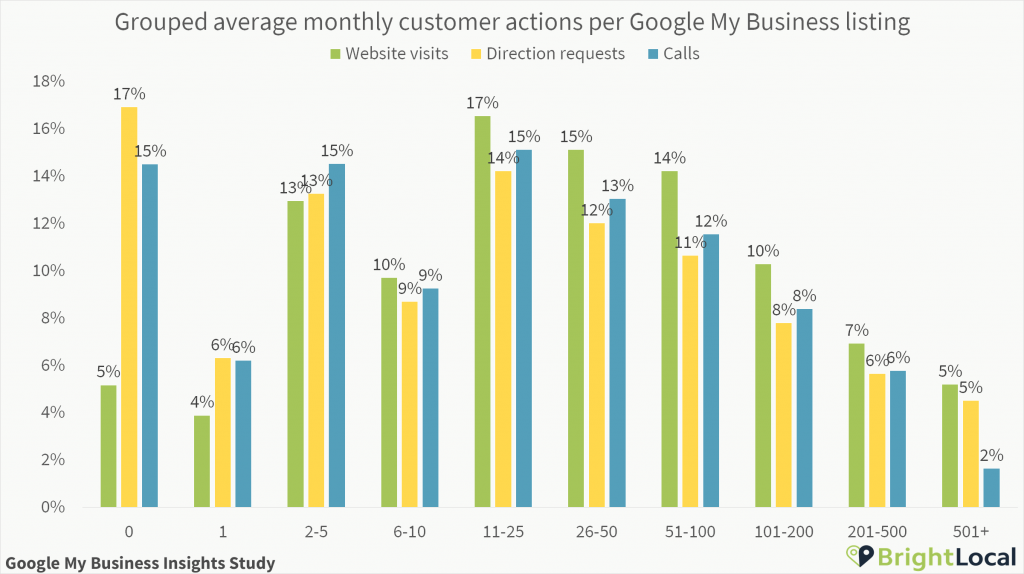
17% of businesses received a median of zero monthly directions requests. In this report, we removed businesses that didn’t have any direction requests in the entire period so we could track the usage of businesses that are using this feature.
This shows that many businesses don’t receive many direction requests – though it’s likely many businesses have these features enabled but wouldn’t receive many direction requests or calls due to the nature of the business.
Yet, 19% receive more than 100 direction requests per month, while 16% receive more than 100 calls per month. For businesses receiving a high number of calls, it’s important to have enough staff on hand to respond to customer queries quickly and in keeping with the expected customer experience.
Services such as CallJoy could help take some of the load off of businesses receiving a high volume of calls. It may also be worth filling out your Google My Business listing with frequently asked questions in Q&A and alternative contact options to pre-empt calls that may come in with the same questions.
Of course, those that are high up in search results are likely to be those receiving the highest number of clicks, calls, and direction requests on a monthly basis, with some industries naturally receiving more than others.
| Direction Requests | Calls | Website Visits | Direction Request Rate | Call Rate | Website Visit Rate |
|---|---|---|---|---|---|
| 1. Hotels (298) | 1. Car dealerships (167) | 1. Car dealerships (576) | 1. Senior living (46%) | 1. Insurance (53%) | 1. Photographers (100%) |
| 2. Car dealerships (145) | 2. Restaurants (127) | 2. Hotels (354) | 2. Hotels (42%) | 2. Automotive (46%) | 2. Marketing and PR (100%) |
| 3. Restaurants (98) | 3. Automotive (68) | 3. Restaurants (173) | 3. Education (39%) | 3. Pet services (42%) | 3. Weddings and events (86%) |
| 4. Senior living (95) | 4. Pet services (67) | 4. Health and fitness (125) | 4. Health and fitness (30%) | 4. Locksmiths (40% | 4. Catering (82%) |
| 5. Health and fitness (70) | 5. Hotels (59) | 5. Tourism and entertainment (115) | 5. Bars (29%) | 5. Repairs (38%) | 5. Business services (80%) |
| 6. Bars (54) | 6. Senior living (44) | 6. Bars (112) | 6. Automotive (26%) | 6. Plumbing and HVAC (38%) | 6. Cleaning (75%) |
| 7. Tourism and entertainment (46) | 7. Health and fitness (41) | 7. Hair and beauty (86) | 7. Alternative health (26%) | 7. Accountants and financial services (35%) | 7. Construction and roofing (75%) |
| 8. Automotive (39) | 8. Hair and beauty (41) | 8. Senior living (67) | 8. Tourism and entertainment (26%) | 8. Dentists (35%) | 8. Tradesmen (73%) |
| 9. Education (32) | 9. Dentists (39) | 9. Pet services (66) | 9. Local stores (25%) | 9. Restaurants (32%) | 9. Landscaping and gardening (73%) |
| 10. Hair and beauty (29) | 10. Repairs (30) | 10. Local stores (51) | 10. Dentists (25%) | 10. Alternative health (32%) | 10. Real estate and property (71%) |
Car dealerships are the standout industry when comparing actions taken from GMB listings. They receive the highest median calls and website visits by a wide margin, and come only second to restaurants in direction requests.
It’s important to note that car dealerships are a less frequently-needed service than industries such as bars or local stores, but they’re also likely to be a little bigger than the average business. Car dealerships seems to be an industry that has understood the potential Google My Business can have – with our Google Reviews Study finding that the average dealership has a whopping 106 reviews.
Insurance and automotive businesses are the most likely to receive a high proportion of calls from their Google My Business listing. But remember that different industries will see different behaviors from customers, so don’t be disheartened at comparatively low numbers in Google My Business Insights. Benchmarking against those in your industry is likely to provide a far more valuable picture of how similar businesses can achieve results from GMB.
Average monthly customer actions per Google My Business listing
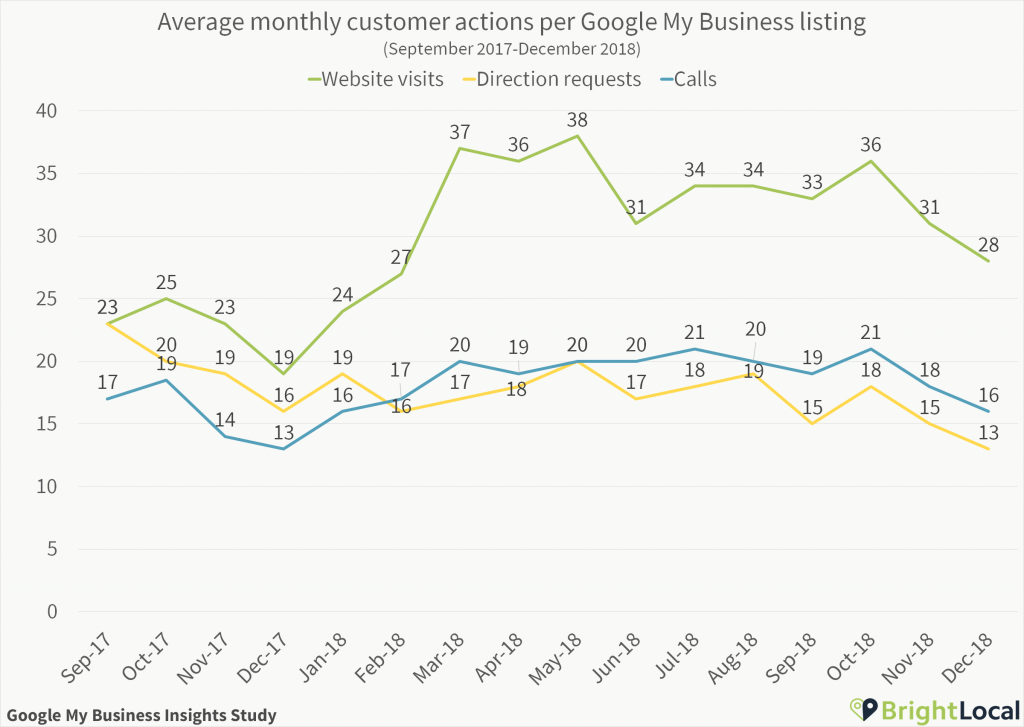
When looking across the time period of our study, there was significant growth in average website visits from March 2018. This growth remained fairly steady for the rest of the year. Comparing Q4 in 2017 and 2018, there was a 29% growth in the number of website clicks, and calls grew by 22%.
While both average calls and website visits are relatively low, this suggests a trend of local businesses benefiting more from their Google listings, and receiving even more high-intent inquiries.
However, average direction requests dropped by 13% across the time period. Perhaps this could be linked to the significant growth in direct searches, suggesting that more customers are viewing GMB listings of businesses they already know about, and thus don’t need to find.
Ben Fisher reviewed this data, and said:
Google My Business continues to grow as a transactional layer of the internet for local businesses. If we look at the growth in calls and direct impressions, this is a good signal that users have much deeper intent when doing a search, and know who and what they are looking for. Also, since calls are tracked mainly on mobile, this shows an increase in mobile maps usage. What I find is surprising is the decline in driving directions; I would think this would rise with the growth in mobile usage.”
| Q4 2017 | Q4 2018 | Sep '17-Dec '18 | |
|---|---|---|---|
| Views on Maps and Search | 1370 | 1325 | 1250 |
| Actions (Website clicks, calls, and direction requests) | 53 | 64 | 59 |
| Conversion Rate | 3.87% | 4.83% | 4.68% |
Perhaps the most useful growth to understand is the link between the number of views the average local business receives and the clicks, calls, and direction requests they receive from customers from GMB listings.
Between October and December 2017, local businesses received 1,370 views on Maps and Search, and an average of 53 actions from customers. By the same period in 2018, overall views had slightly dropped, but actions had grown to 64 per month.
This equates to a conversion growth of 25% – growing from 3.87% to 4.83%. To compare, the conversion rate from view to click, call, or direction request was 4.68% across the whole timeframe.
As per the theme, car dealerships have the highest conversion rate (7%), followed by dentists, family services, health and fitness, and pet services, with a conversion rate of 6% each. Photographers, marketers, and locksmiths have the lowest proportion of actions per GMB listing view. To help you benchmark, download the full industry breakdowns at the end.
Phone Calls
We viewed the average number of calls reported in Google My Business Insights between September 2017 and December 2018. We have shown these as a proportion of overall calls, rather than numbers, to better represent what the average business would see in their Google My Business Insights.
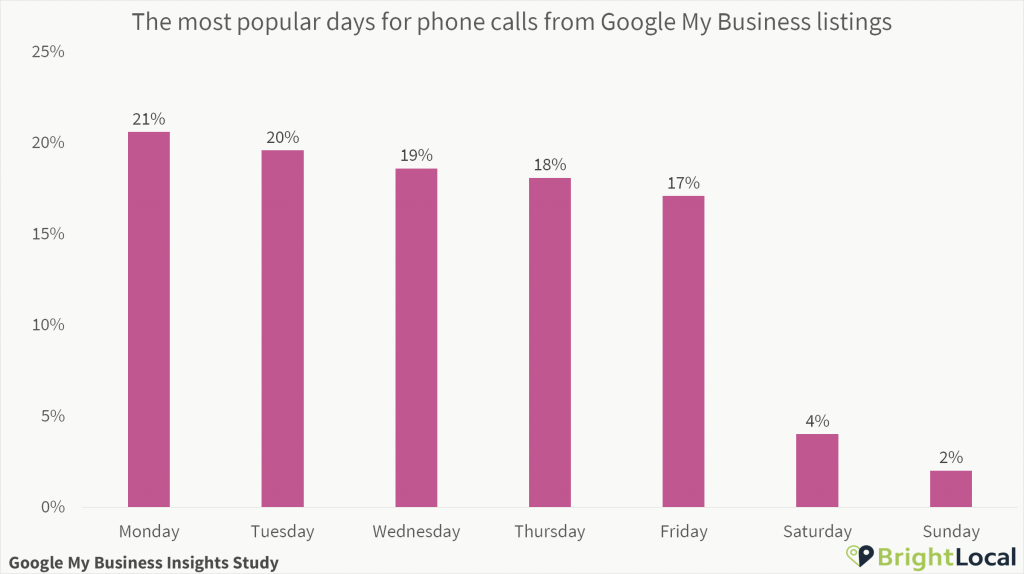
Day of the Week
Key Findings
- Local businesses receive 94% of calls from GMB between Monday and Friday
- The most likely time to receive calls from GMB is 10am to 12pm
- Restaurants, bars, and locksmiths all receive a high proportion of calls on the weekend
The typical local business receives 94% of its calls from Google My Business between Monday and Friday, in line with many business types’ traditional working hours.
Businesses tend to receive more calls at the beginning of the week, seeing a sliding scale through to Friday.
However, of course, this trend differs across industries. Restaurants receive 32% of their calls at the weekend, with locksmiths not far behind with 31%. Likewise, bars receive 36% of calls on Fridays and Saturdays.
To help you benchmark, we’ve included all this data in the downloads at the end.
Time of Day
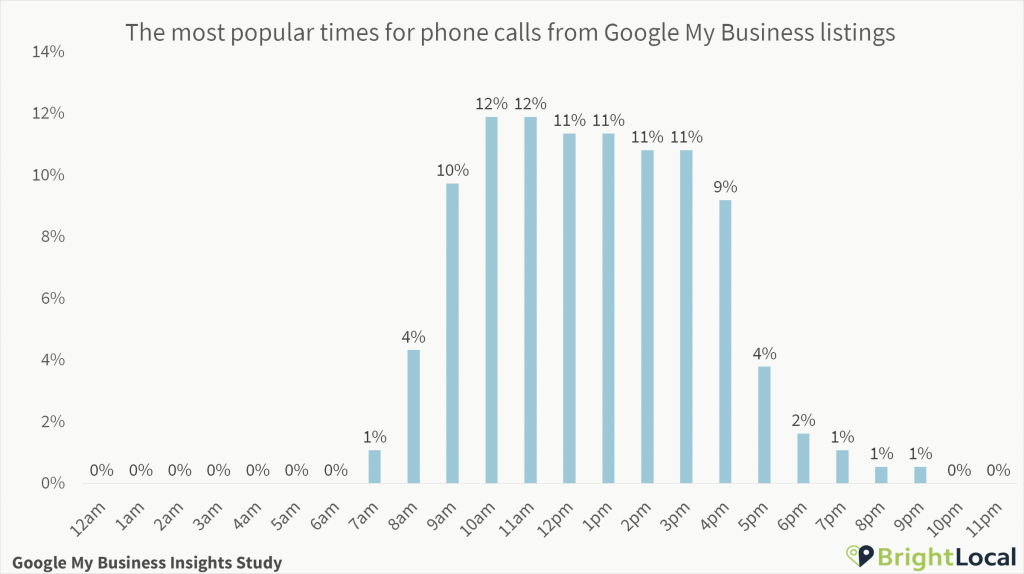
The average business tends to receive the most calls between 10am and 12pm on Mondays.
In fact, local businesses appear to receive a split of calls from GMB between 9am and 5pm, as you’d probably expect!
But again, this can be very different depending on the type of business. Restaurants receive 51% of their calls after 5pm – likely due to customers phoning to place orders or book tables. Of course, with many businesses opting to add reservation options to their GMB listings, overall call numbers could drop if customers get used to using this service.
Locksmiths, too, receive a high proportion of calls outside of traditional hours, with 34% after 5pm, and a further 8% before 9am.
Photo Quantity
This data explores the median number of photos per business. In this section, we only viewed businesses that had at least one photo on their Google My Business listing. Numbers of photos include those uploaded by the business and those shared by customers.
Average Number of Photos per GMB Listing
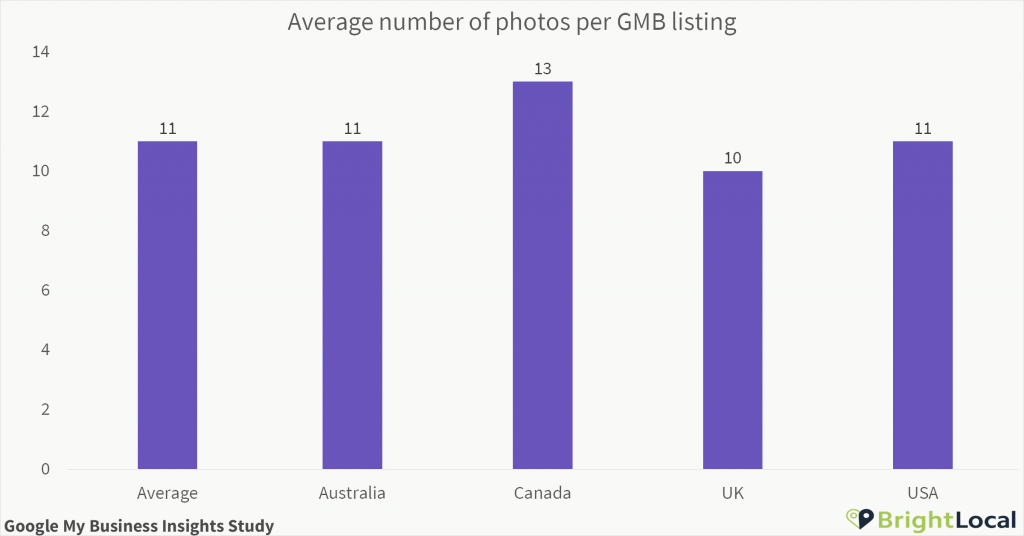
Key Findings
- Google My Business listings have an average of 11 photos
- Hotels have the most photos on GMB, with a median of 150 each
- 6% of Google My Business listings only have one photo
Google reports that, “Businesses with photos receive 42% more requests for driving directions to their location from users on Google, and 35% more clicks through to their websites than businesses that don’t have photos.”
When looking at businesses that do have photos, we found that the median business has just 11 photos. Canadian businesses have the most photos on GMB (13), with the UK falling behind with 10.
Local marketing expert Claire Carlile explained why images are important:
We exist in very visual internet culture where we curate images carefully in view of what we believe they say about us both personally and professionally – why can’t we extend the same careful curation to our images on GMB? Given what we know about the importance of images in a business profile, businesses desperately need to get on board with making more of their photos. They need to add images to GMB regularly, curate and spring clean their images on a reasonably regular basis, and also encourage customers to take photos at their location and upload these onto Google Maps, wherever relevant. If businesses invested half as much effort into building out their image portfolio on GMB as they did on adding images on Facebook or Instagram, they’d be in much better positions.”
Grouped Average Number of Photos Per GMB Listing
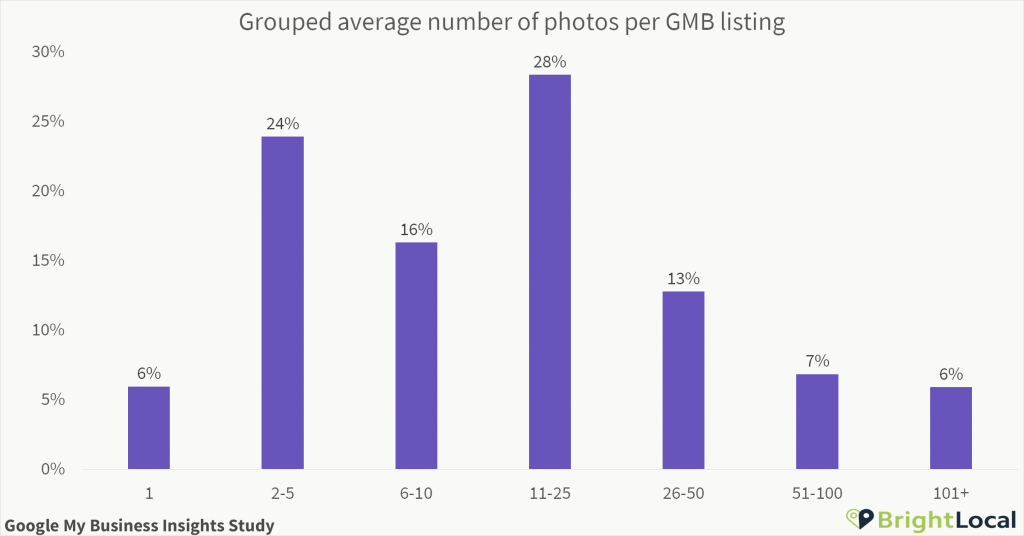
6% of businesses have just one photo on Google My Business, and a further 24% have between just 2 and 5.
GMB encourages users to set their cover photo and logo, and there are suggestions that Google may (or as now it seems, may not) be adding prominence to photos with new logo and photo displays, so there may soon be an uptick in the number of photos the average business has.
However, 13% of businesses have more than 50 photos on their GMB listings, including both photos uploaded by the business and by customers.
Average Number of GMB Photos Per Industry
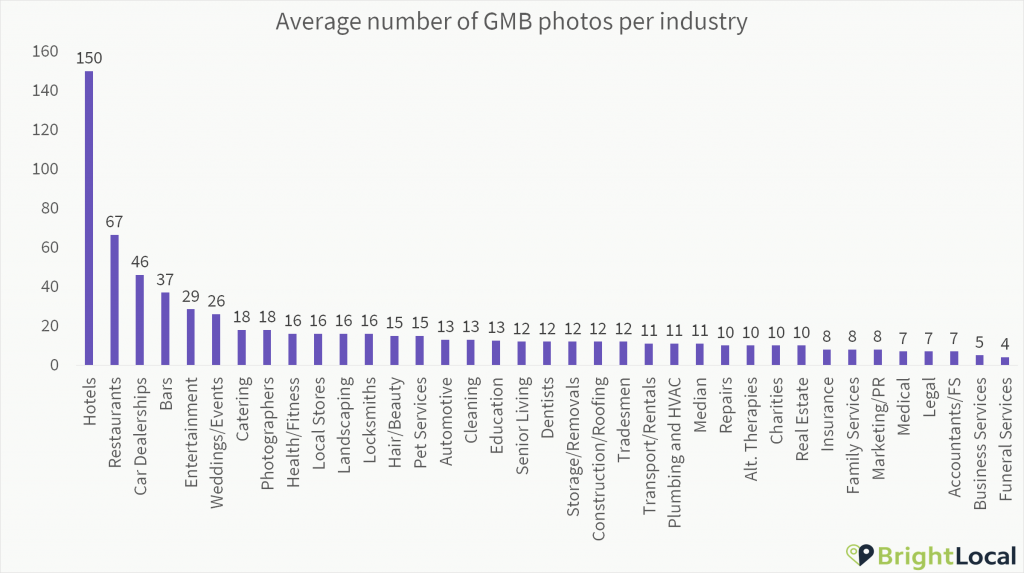
The number of photos a business has on its Google My Business listing drastically differs by industry.
While some industries lend themselves more to imagery, it’s also important to note that Local Guides are often asked to add photos they’ve taken when visiting a business.
Of course, while many customers may take photos of their food in a restaurant, it’s unlikely others will visit a legal practice or accountancy firm and be prompted to do the same. This means that it’s key for the less photogenic businesses to ensure their photo library is up to date, and paints their business in the best light.
On average, hotels have a huge 150 images each. Tourist and entertainment spots have 29, though this will be swayed depending on how big the attraction is.
Claire Carlile explained the differences in numbers of photos between industries:
People take plenty of photos on their holidays – I’m guessing that ‘customer photos’ are really boosting the number of images in four of the top 5 industries here. As for car dealerships, can we credit Greg Gifford for positively influencing the local marketing efficacy of dealerships? Or do people just take a lot of photos of themselves buying cars? There are so many ways to create opportunities for people to take photos at your location – I was surprised when my tiny dealership in Wales, UK created a ‘big reveal’ experience for my new car. Creating photo-worthy experiences is key to driving photo uploads from customers. Of course, some industries are unlikely to get customer photos uploaded, and for these industries the importance of regular uploading of good quality owner photos is magnified manyfold.”
How Images on Google My Business Listings Impact Actions
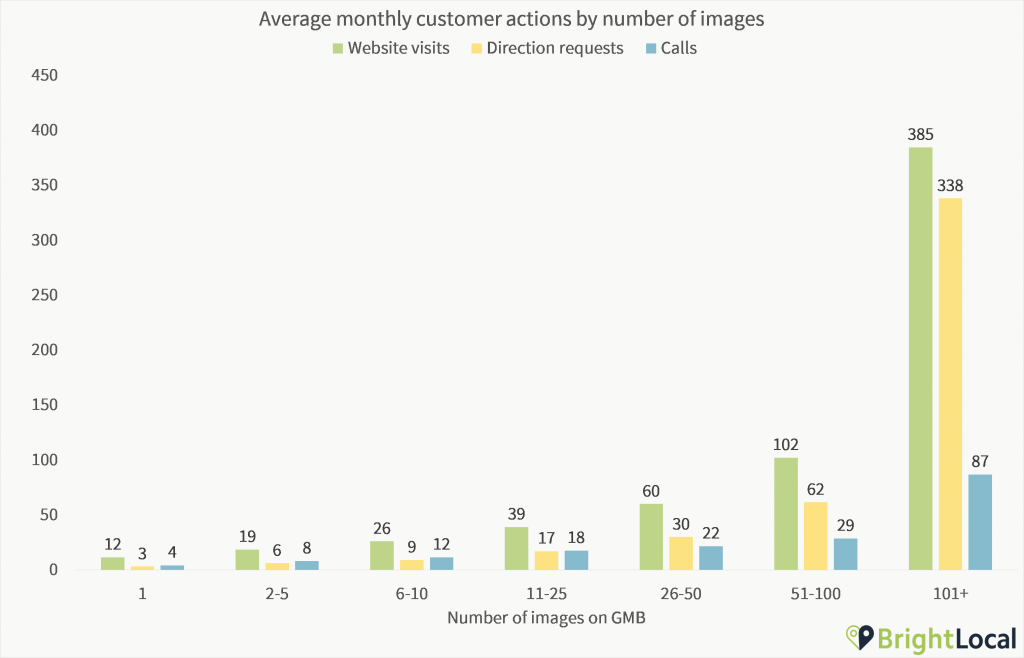
We also looked into the links between the number of photos a business has on Google My Business, and their Google My Business Insights. The research found that businesses with more than 100 images on GMB get 520% more calls, 2717% more direction requests, and 1,065% more website clicks than the average business.
Of course, these businesses with a high number of images may be in industries that are not only predisposed to a higher number of images from customers, but may be businesses that are ‘better’ at Google My Business in general. For the full breakdown, check out our breakdown on Search Engine Land.
Annual change in average monthly Google My Business Insights per listing
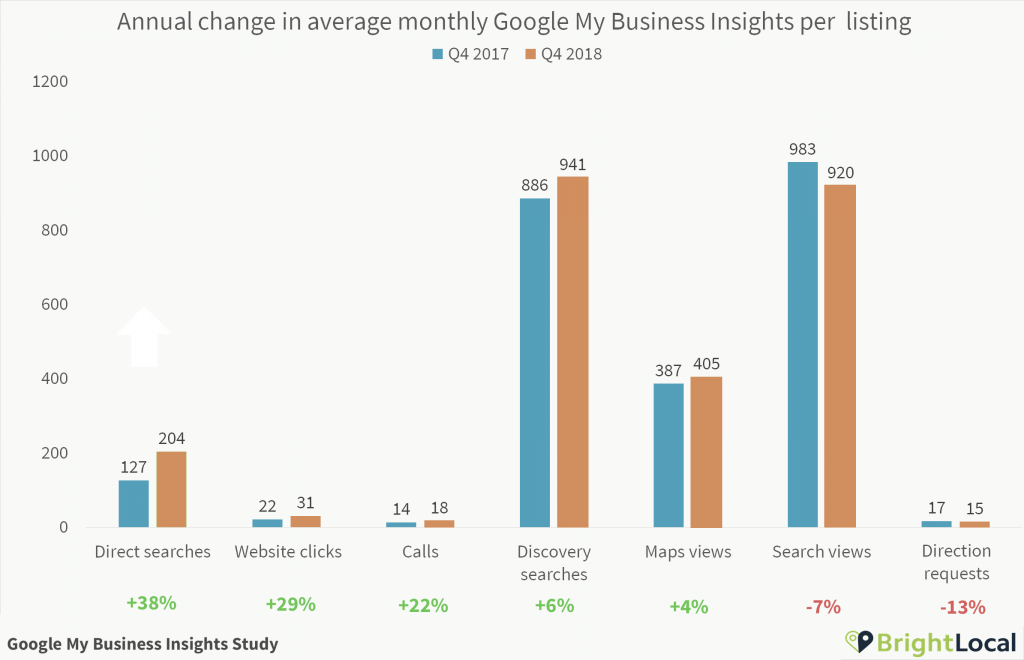
When comparing the final quarters of 2017 and 2018, there have been some significant gains, as well as a few dips.
Although growing from a lower base than some of the other metrics, direct searches, website clicks, and calls all saw significant growth in 2018. Direct searches saw the most growth, jumping 38%, and suggesting a shift towards searchers using GMB to find information on businesses they already know.
Google My Business is a critical tool for local businesses, with tons of potential for being found by new customers, and creating decisions before the customer has even got in touch. But it’s still underused. Many local businesses haven’t yet claimed their listing and as shown in this report, many are not using it to its full potential.
To track your own GMB Insights, our Google My Business Audit tool gathers all key local ranking signals in one place, making it simple to compare listings against competitors, as well as having six times more data than Google My Business.
Google My Business Insights Per Industry
| Industry | Number of Businesses | Images | Direction requests | Calls | Website clicks | Search views | Maps views | Discovery searches | Direct searches | Action rate per view |
|---|---|---|---|---|---|---|---|---|---|---|
| Accountants/FS | 1672 | 7 | 4 | 7 | 9 | 492 | 155 | 507 | 49 | 3% |
| Alt. Therapies | 1716 | 10 | 19 | 23 | 31 | 1075 | 282 | 922 | 123 | 5% |
| Automotive | 2076 | 13 | 39 | 68 | 41 | 2228 | 1890 | 1948 | 255 | 4% |
| Bars | 302 | 37 | 54 | 23 | 112 | 2484 | 2269 | 2190 | 470 | 4% |
| Business Services | 583 | 5 | 1 | 1 | 8 | 225 | 57 | 156 | 61 | 4% |
| Car Dealerships | 720 | 46 | 145 | 167 | 576 | 7740 | 4877 | 5062 | 2053 | 7% |
| Catering | 161 | 18 | 3 | 4 | 31 | 784 | 288 | 597 | 132 | 4% |
| Charities/Organizations | 389 | 10 | 10 | 7 | 29 | 992 | 451 | 781 | 149 | 3% |
| Cleaning | 1062 | 13 | 0 | 3 | 10 | 392 | 45 | 409 | 28 | 3% |
| Construction/Roofing | 2482 | 12 | 2 | 4 | 18 | 516 | 100 | 469 | 67 | 4% |
| Dentists | 2287 | 12 | 28 | 39 | 46 | 1312 | 486 | 1221 | 237 | 6% |
| Education | 852 | 13 | 32 | 18 | 33 | 1167 | 711 | 950 | 176 | 4% |
| Family Services | 192 | 8 | 12 | 11 | 32 | 703 | 282 | 617 | 101 | 6% |
| Funeral Services | 291 | 4 | 12 | 13 | 35 | 716 | 632 | 519 | 175 | 4% |
| Hair/Beauty | 1090 | 15 | 29 | 39 | 86 | 2262 | 778 | 1902 | 292 | 5% |
| Health/Fitness | 1241 | 16 | 70 | 41 | 125 | 2427 | 1317 | 2053 | 405 | 6% |
| Hotels | 728 | 150 | 298 | 59 | 354 | 13042 | 14434 | 8480 | 2011 | 3% |
| Insurance | 905 | 8 | 6 | 21 | 13 | 745 | 317 | 722 | 95 | 4% |
| Landscaping | 639 | 16 | 1 | 5 | 16 | 431 | 60 | 401 | 50 | 4% |
| Legal | 2548 | 7 | 3 | 8 | 16 | 697 | 110 | 822 | 71 | 3% |
| Local Stores | 2989 | 16 | 24 | 20 | 51 | 2018 | 1108 | 1757 | 208 | 3% |
| Locksmiths | 296 | 16 | 0 | 2 | 3 | 176 | 34 | 185 | 6 | 2% |
| Marketing/PR | 1120 | 8 | 0 | 0 | 3 | 98 | 33 | 125 | 12 | 2% |
| Medical | 3404 | 7 | 22 | 28 | 44 | 1415 | 366 | 1221 | 197 | 5% |
| Pet Services | 1097 | 15 | 27 | 67 | 66 | 1586 | 916 | 1318 | 316 | 6% |
| Photographers | 326 | 18 | 0 | 0 | 7 | 276 | 36 | 254 | 29 | 2% |
| Plumbing and HVAC | 1306 | 11 | 3 | 14 | 20 | 900 | 172 | 957 | 112 | 3% |
| Real Estate | 2976 | 10 | 3 | 4 | 17 | 500 | 184 | 429 | 74 | 4% |
| Repairs | 601 | 10 | 6 | 30 | 42 | 2086 | 355 | 2300 | 101 | 3% |
| Restaurants | 1128 | 67 | 98 | 127 | 173 | 6386 | 5439 | 5570 | 701 | 3% |
| Senior Living | 691 | 12 | 95 | 44 | 67 | 1555 | 3095 | 1100 | 508 | 4% |
| Storage/Removals | 1153 | 12 | 6 | 14 | 38 | 1066 | 391 | 1086 | 94 | 4% |
| Tourism/Entertainment | 505 | 29 | 46 | 18 | 115 | 2619 | 2224 | 1981 | 463 | 4% |
| Tradesmen | 1756 | 12 | 1 | 3 | 11 | 387 | 59 | 414 | 36 | 3% |
| Transport/Rentals | 344 | 11 | 4 | 10 | 33 | 1140 | 601 | 1018 | 127 | 3% |
| Weddings/Events | 244 | 26 | 4 | 3 | 44 | 1141 | 240 | 892 | 142 | 4% |
Download Google My Business Insights Per Industry
Methodology
For this study, we explored anonymous data for 45,264 local businesses across 36 industries in the USA, Canada, Australia, and the UK.
To do this, we reviewed data from a randomly chosen sample of Google My Business Insights between September 2017 and December 2018. Businesses did not necessarily have data for every month in the timeframe, and businesses that did not have an active Google My Business listing have been removed where relevant.
Businesses that did not receive data for the whole period or a significant period were removed from data comparisons in order to measure the effectiveness of Google My Business features for businesses that have them (for example, removing businesses that do not have an option for customers to call from their local business listing). Businesses that have no photos were not included in the photos data.
In line with BrightLocal’s main audience, the dataset is based on businesses from the US, Canada, Australia, and the UK. This included 32,843 businesses in the US, 2,913 in Canada, 3,857 in Australia, and 5,651 in the UK. Averages are based on medians.
The 36 industries were created by grouping business categories. We did this to ensure we had a large enough sample to draw conclusions from industries. For more information on the number of businesses in each industry, download the full dataset in the table above.
For more information on this study, or for any questions you may have about the findings of the Google My Business Insight Study, please let us know on content@brightlocal.com. Publishers are welcome to use charts and statistics crediting BrightLocal and linking to the report.
How do your Google My Business Insights compare against businesses like yours? Leave a comment below to let us know your thoughts.