


![Are We Experiencing a Local Algorithm Update? [Local RankFlux Data – November 2019 Bedlam Update]](https://brightlocal-corp-assets.s3.amazonaws.com/brightlocal-corp-2026/wp/uploads/2019/11/Local-RankFlux-November-1.png)
[Update: November 28th, 2019] After Local RankFlux initially tracked higher than usual ranking fluctuations at the beginning of November, new theories have emerged as the local search community tries to make sense of the changes; the local algorithm update has been coined ‘The Bedlam Update’, by Joy Hawkins, while theories are circulating that flux in the local pack could be a result of what sites Google deems relevant. Another theory, dubbed “Swapasaurus GMB” claims that while position #1 remains stable, #2 and #3 are subject to more volatility. Read on for an analysis of the ranking changes during the most volatile period, 1-8 November.
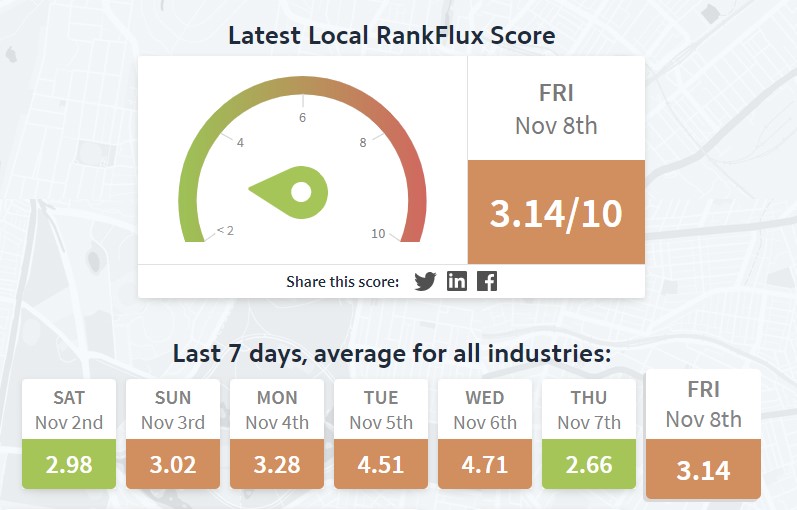
Since Saturday, November 2, our local algorithm tracker, Local RankFlux has been reporting higher than usual ranking fluctuations.
While daily volatility levels usually sit within a score of 2.2-2.8, we’ve seen notable fluctuation across all industries. This suggests the possibility of changes to the local algorithm, with Wednesday seeing a peak of 4.71 – nearly double the usual daily score.
With many marketers reporting high levels of change for the businesses they manage, we wanted to explore our data to see how significant this local ranking flux may be – and see if some ranking positions may be influenced more than others.
Local RankFlux tracks daily ranking movements across 14,000+ keywords to measure volatility and identify suspected algorithm updates. It compares data to the previous day, and creates a score based on the fluctuations in different ranking groupings. Data is split across 26 different industries, as well as providing an overall daily score.
This week’s volatility appears to have affected most industries equally. Therefore, we focused the below data exploration on how volatile local businesses are across the top 20 local ranking positions.
To find out more on the tool, sign up for alerts, and see volatility in each industry, explore Local RankFlux here.
Average Local Ranking Movements (Only Businesses With Movements)
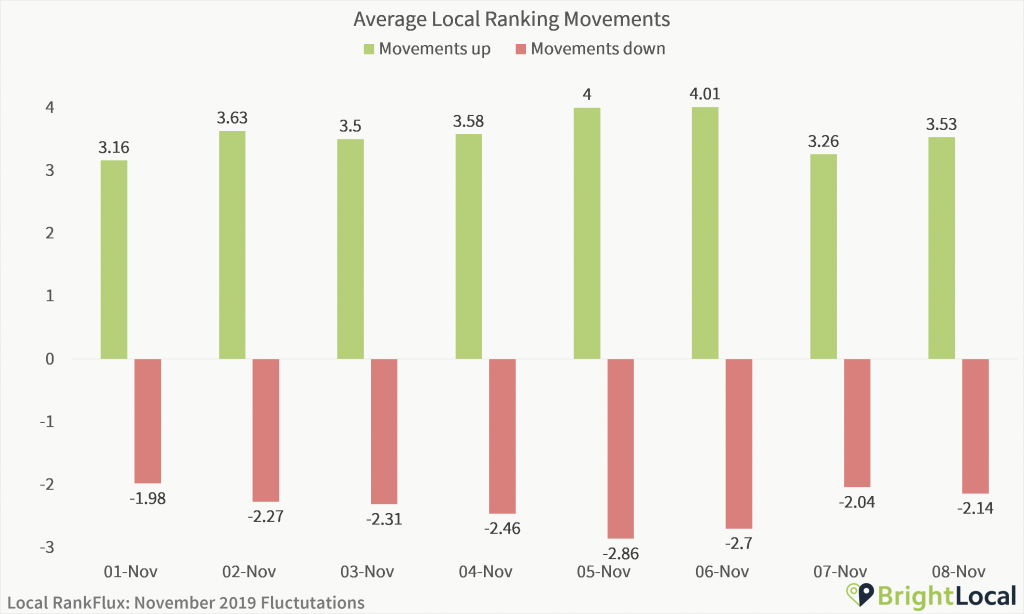
Looking at daily ranking changes it seems that there were increased movements in both directions for those businesses that saw changes.
While, of course, if some businesses go up, others must go down, this data shows that businesses that improved in rankings saw a bigger change than those that decreased.
Starting from 1 November, a seemingly ‘normal’ day for volatility, the average improvement was 3.16, while the average drop was 1.98 places. We’ve taken this day to be a ‘usual’ day to ease comparisons.
On Wednesday, the most volatile day (Local RankFlux Score: 4.71), the average movement up was 4.00 positions, and movement down 2.86. This represents a positive movement increase of 27%, while the negative movement rate increased by 44%.
As explored below, as volatility increased, the proportion of businesses seeing no daily ranking changes dropped. When looking at all businesses, not just those that saw changes, it’s evident that the rate of change differs between ‘normal’ and volatile days.
Average Local Ranking Changes (All Businesses)
| Date | Average Change |
|---|---|
| 01-Nov | 1.25 |
| 02-Nov | 1.60 |
| 03-Nov | 1.59 |
| 04-Nov | 1.69 |
| 05-Nov | 2.31 |
| 06-Nov | 2.41 |
| 07-Nov | 1.41 |
| 08-Nov | 1.69 |
Average Local Ranking Movements Per Grouping
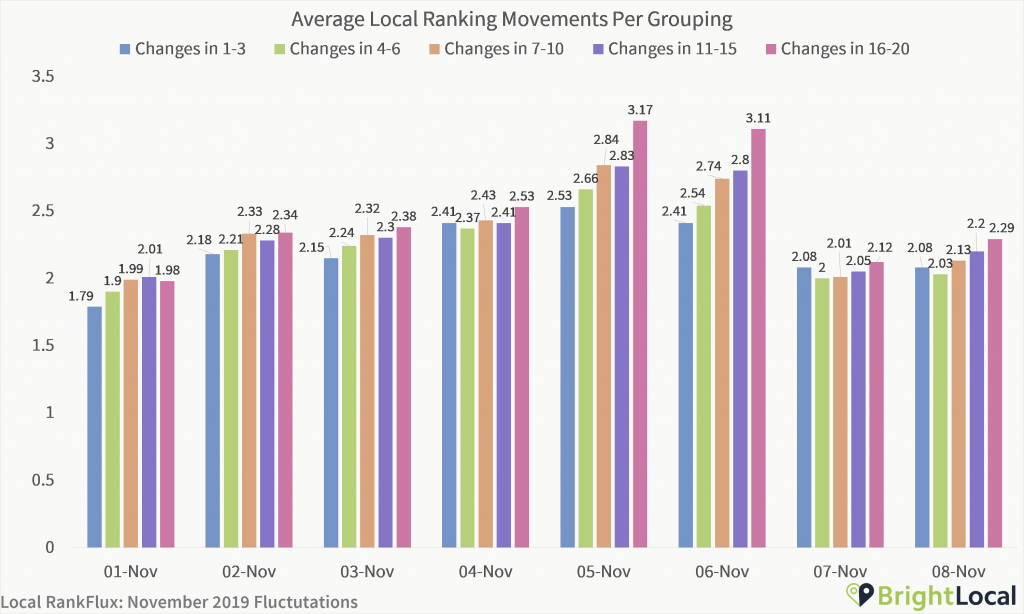
To understand which areas are seeing the most significant fluctuation, we split the ranking movements by grouping.
We found that changes fluxed throughout the week – with every grouping seeing significant changes between normal and the most volatile days.
Comparing 1/11 to 5/11, increases per average ranking movement are up:
- 1-3: 41%
- 4-6: 40%
- 7-10: 43%
- 11-15: 41%
- 16-20: 60%
However, it’s possible that some businesses saw fluctuations both up and down over the course of the week. For the purposes of this data, we haven’t explored businesses changes over a longer period – so please leave a comment below if your rankings have seen yo-yoing results.
Local Ranking Position Movements by Date
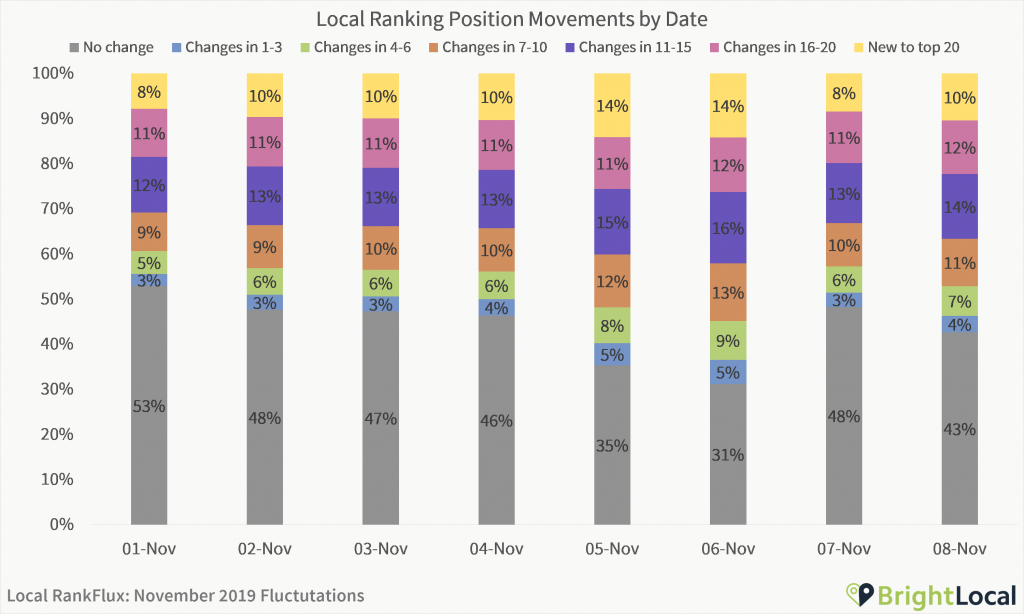
The chart above compares the proportion of changes within different ranking groupings over the last week. The different groupings are based on the businesses that were in these ranking groupings on the previous day, that saw positive or negative changes – for example, a business that dropped from 2 to 4 would be represented within Changes in 1-3, while a business that dropped from 4 to 5 would be represented in Changes in 4-6.
Starting from 1 November, a seemingly ‘normal’ day for volatility, we saw a big drop in rankings that saw no changes at all.
When comparing volatile Wednesday with this ‘usual’ day, there was a significant drop in the proportion of businesses seeing no change at all – equating to a 42% decrease.
Local Ranking Position Movements by Ranking Groupings (Only Businesses With Movements)
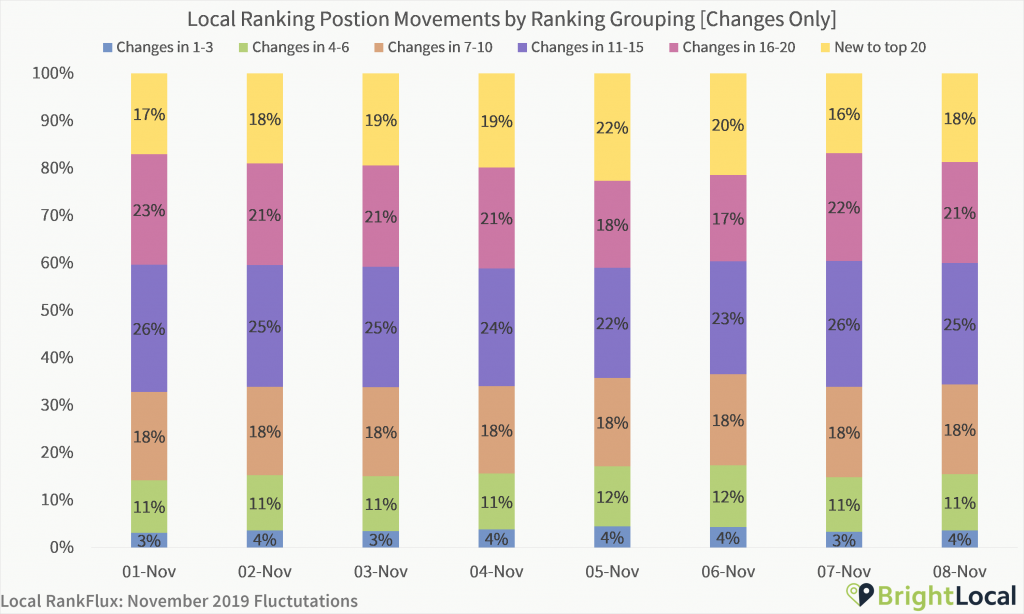
Looking at only the businesses that did see day-to-day change, we see a small (but not insignificant) growth in the proportion of businesses seeing change within the local 3-pack. Businesses in positions 4-6 also saw increased volatility.
There was also an increase in the number of businesses entering the top 20 – up from 17% of ranking businesses on 1/11, to 22% on 5/11, and 20% of 6/11.
Local Ranking Position Movements by Ranking Grouping
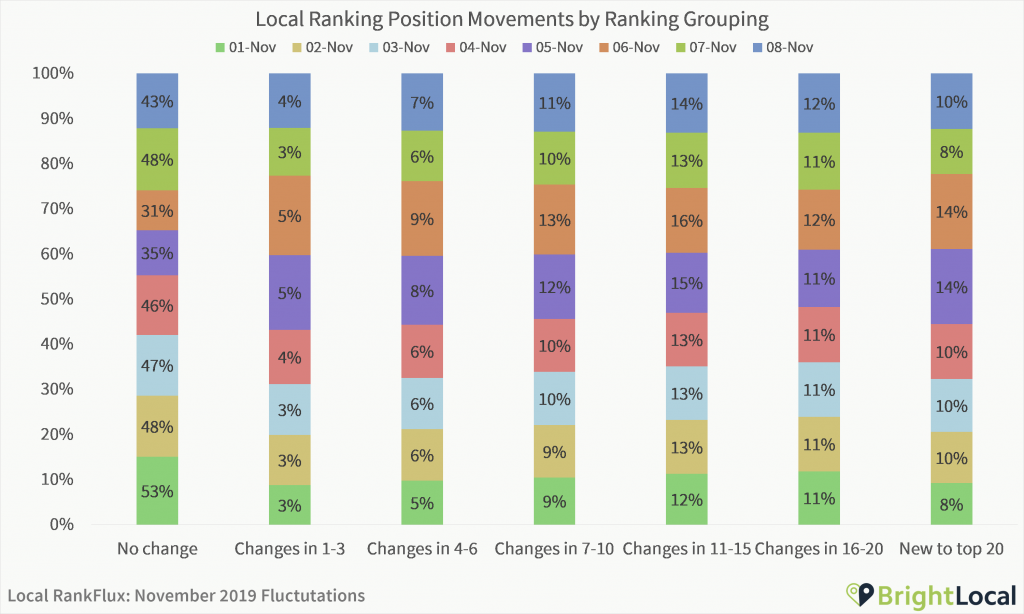
We’ve also cut the above charts by ranking groups to help visualize the days that saw the most notable change.
Local Ranking Movements by Date(Only Businesses With Movements)
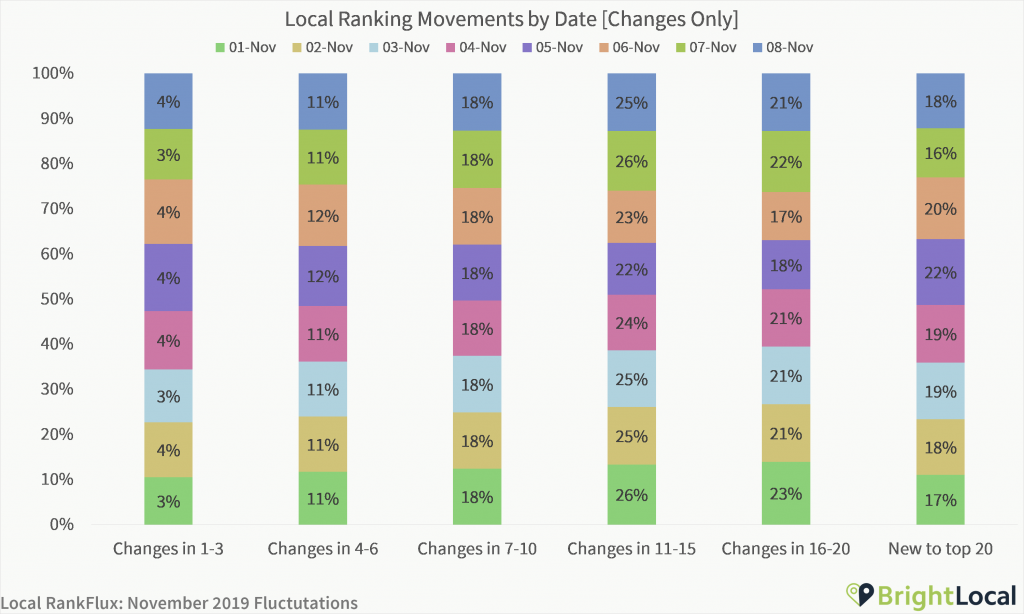
As you can see, new entries saw significant change on the most volatile days. We’ll continue monitoring Local RankFlux data to track changes as volatility continues.
So, What Happened?
At the time of ranking, there has been no official confirmation from Google of a local update, but the ripples are being felt. On Thursday, Barry Schwartz reported on the volatility, sharing Twitter and the Local Search Forum discussions on this possible change. It has also been noted over at r/bigseo, and now has a dedicated thread for observations at Local Search Forum.
It’s a pretty big update. Financial category is badly affected.
— Amit%20Tiwari (@teamamittiwari) November 7, 2019
One marketer got in touch on Facebook to share his experiences with the volatility. He believes that it could be an experiment “gone wrong” that has led to some supposedly spammy listings taking the place of established businesses.
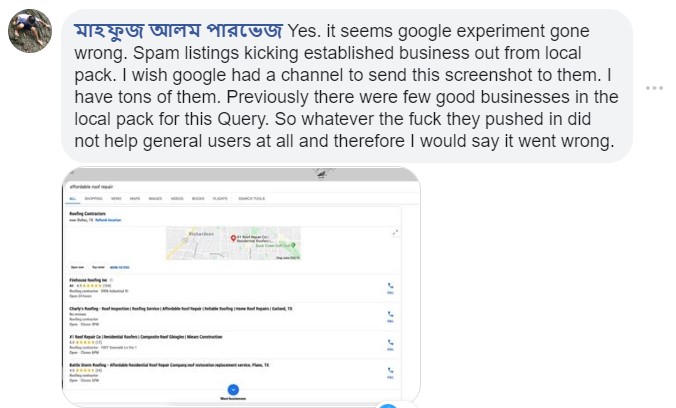
He shared screenshots with us of local rankings changes, with some businesses that had no reviews taking the place of previous high rankers. Of course, one marketer’s experience does not create enough proof to form a theory – so please do let us know your experiences in the comments below.

This idea of a ‘mistake’ has also been suggested by Joy Hawkins.

Over the weekend (9-10 November), Local RankFlux continued to be volatile reaching 4.65.
Another big day for local volatility. Are you seeing further changes to your rankings, or are businesses returning to their pre-flux positions?
*Today’s #LocalRankFlux Score is 4.65* https://t.co/TMgfCQ9BR3
— BrightLocal (@bright_local) November 10, 2019
With the local SEO industry discussing the possibility of this flux being related to an error, we could be seeing higher volatility as businesses return to their previous positions. We’d certainly hope that Google wouldn’t choose to make a change that seemed to benefit spammy businesses.
I still say this is the sky is falling update. Meaning a mistake.
— Ben Fisher (@TheSocialDude) November 8, 2019
We’ll look forward to hearing the experiences and theories of the local SEO experts over the coming week. If you had any thoughts on this volatility, or experiences of change, let us know in the comments below.