
Update June 2025: Andy kindly added new functionality to the Looker Studio dashboard, as well as advice in this article on how to use it. The addition is specifically created to help spot ‘Possible AI Overviews’.
Introducing the “What, Where, Why, When, How, Are, Can, Who, Is, Do and Near Me” Looker Studio Dashboard you never knew you needed!
Keyword research has always formed a critical part of SEO, and it’s no slouch when it comes to local SEO, either. The searches people make to find your products and services can inform your Google Business Profile content, your FAQs, and beyond.
You might have access to Google Search Console and Google Analytics and so forth, but when you put all this search data together, and analyze it with a sophisticated Looker Studio dashboard, the insights you can gain are so much more valuable, as well as more easy to organize!
It can be daunting for some to dive into GSC and find all those “what, where, why, when, how, etc.” type search queries, so that’s why I created a simple Looker Studio dashboard to visualize the data in a much clearer format.
- Immediately see what questions your potential customers are asking to find your product or service
- Easily sort questions by impressions, clickthrough rate and average position
- Edit the report for different search queries to suit your business needs
- Share the report with others in your business

Here are just a few ways you can use the data in this dashboard:
- FAQ content creation – what questions are customers asking, and how do I rank for them?
- Location-specific content
- Keyword research
- Q&As for your Google Business Profil
- Identify AI Overview opportunities from common trigger queries
Already a dab hand at Looker Studio? Get stuck right in! You’ll find clear links to the dashboards below.
Not a clue where to begin with Looker Studio? No problem! I’ve written out a full tutorial that will explain how to use this powerful tool, and give you a crash course in Looker Studio customization at the same time!
How to Use the Looker Studio Local Keyword Research Dashboard
This tutorial is aimed at the beginner Local SEO, or the business owner who wants to dive into their site data a little bit more, but the dashboard can be used by beginner and advanced SEOs alike.
For the Looker Studio beginner, the difficult part is connecting it to your site data in GSC, but that’s what we’re going to go over in the tutorial below.
There are two Looker Studio reports for you to use: the first one you can just plug and play, and I am going to show you how to use the second one to make that one more business/client-specific by customizing it, then showing you how you can get more “local” by searching for location-specific search queries.
Before We Start
As Looker Studio is a Google product, the Google Account you use to create your report will have to be associated with the GSC accounts you want to apply these dashboards to. If you don’t have access to your GSC accounts, sort that out first and then come back here and you’ll be ready to go.
Note: Both dashboards default to using the sample GSC query data provided by Google from its merchandise store (go have a look at the data; it’s quite interesting).
Dashboard 1: The “What, Where, Why, How” and more… Query Dashboard
As mentioned above, this first dashboard is just set up for plug and play. If you want deeper customization, head to Dashboard 2 further down the page.
Simply click on the link below to open up the dashboard in Looker Studio.
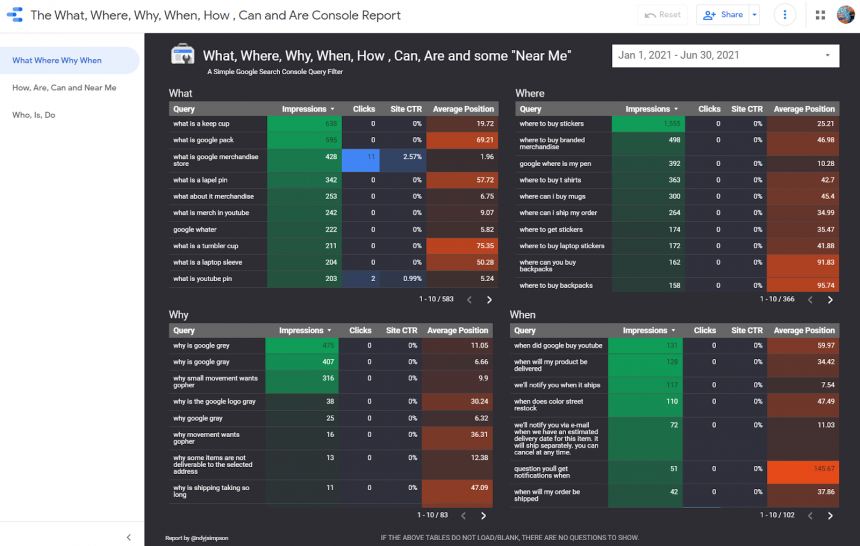
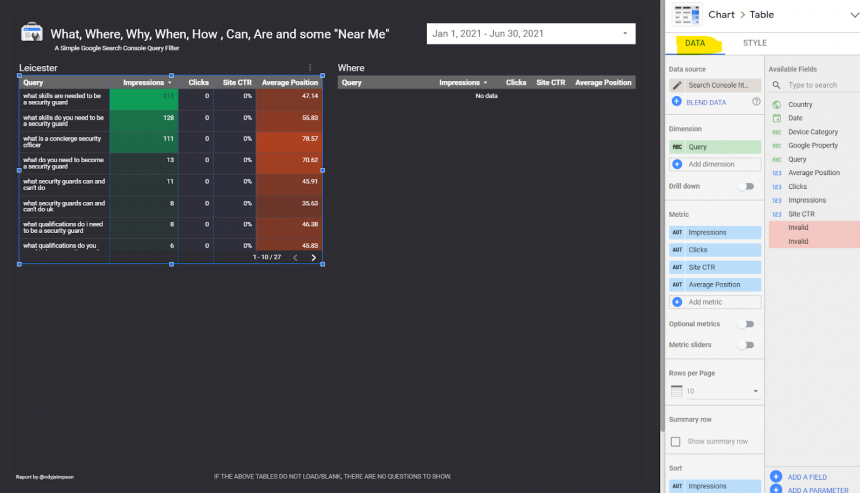
This is what you will see:
As explained above, you now see the filtered query data from the Google merchant store. Now all you have to do is select the data from your client(s) account, by choosing from the dropdown menu from “Default Data” .

You should see all your GSC accounts associated with the Google account you are currently logged into.
If you don’t see any data, you may need to switch accounts and try again. Select an account you want to use for this dashboard and the tables will populate to use the data from your client’s GSC account.
Note: As it says on the dashboard below the tables, “If the above tables do not load/blank, there are no questions to show”. If the tables show no data, either your site isn’t answering user queries, or you may have to adjust the date range.
Because these reports default to “This year to date,” you may want to change the start date to a date in the past. If you’re reading this in January, February, or March, then you may not have much data to show, so go back to the previous year like so:

There are three pages to this report, and you can move between the three pages by using the navigation on the left of the report.

Select any of the three pages and you’ll see that the tables will populate with your GSC client data.
What about ‘Near Me’ searches?
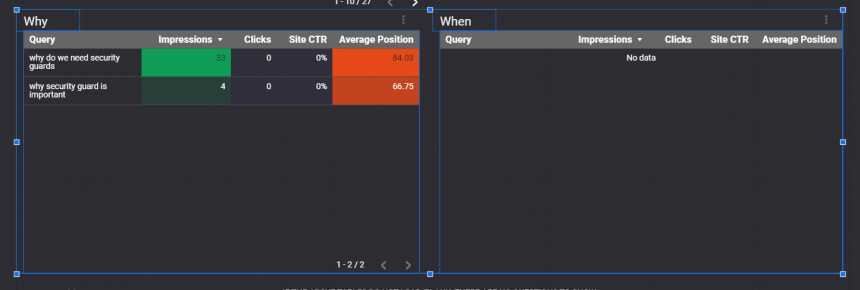
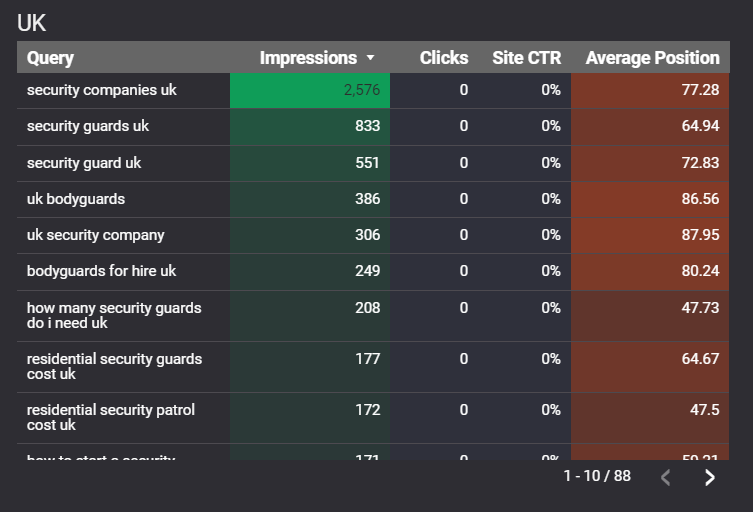
Because I do local SEO, I am always interested in the “near me” type searches so I’ve included this query on the second page. In the example below, a UK-based security company, we can see some of the opportunities that they could possibly focus their content towards by perhaps just a few tweaks to the site’s content.

It’s worth noting that you can also sort the data by any metric, such as Impressions (default), Clicks, Site CTR (click-through rate) and Average Position.
Below I’ve sorted the previous table by “Average Position”.

Don’t forget that “near me” searches are going to be very proximity-focused, so these queries could be displaying your GMB listing in the Local Pack or Google Maps, and not your site in the search results.
Dashboard 2: The “What, Where, Why, How and more…” Custom Query Dashboard
Okay, so how do we make this data even more local? That’s where this second dashboard comes into play. We have to get a little bit more technical with the setup and the filtered query data, but it’s worth it for the extra insights!
This report has the same requirements as above. You will need access to your or your clients’ GSC account.
Simply click on the link below and it will open up the dashboard in Looker Studio.
This is what you will see:
It’s almost the same as the first dashboard, but there is no data selection option!
That’s because we’re going to take a copy of this report and connect it directly to just one GSC account, so that any changes/edits we make are directly related to just that one account, turning it into customized Looker Studio dashboard for just you or your client’s data, which you can then edit and play with.
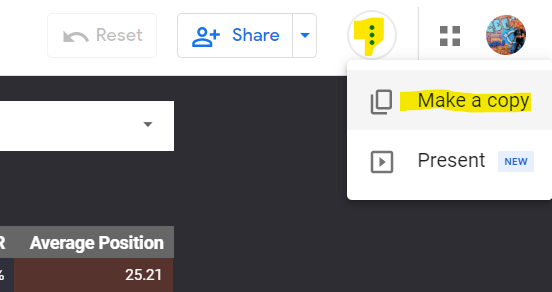
So the first thing we want to do is make a copy of the dashboard and connect it to a specific GSC account: select the three dots in the top right of the window and choose “Make a copy”.
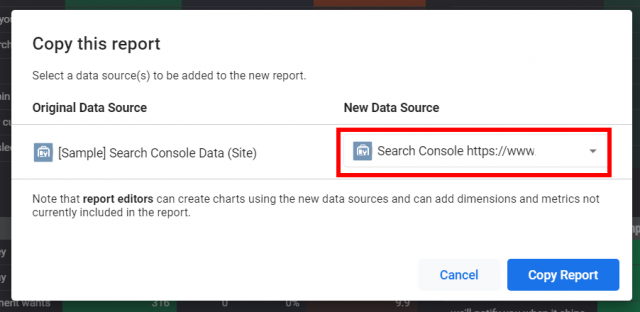
You should then see this window appear:
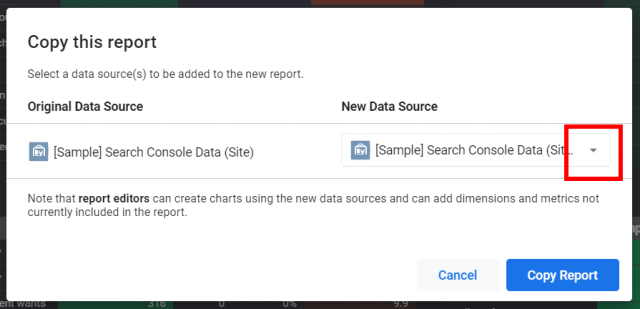
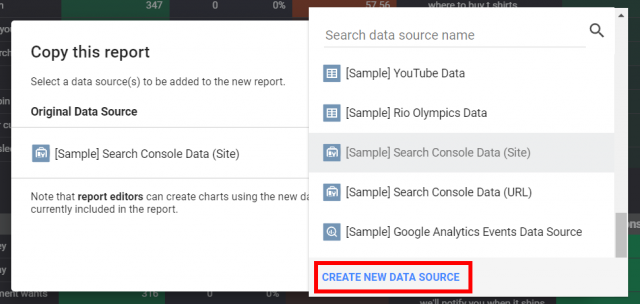
Select the dropdown option from “New Data Source”, as above, and choose “Create New Data Source”, as below.
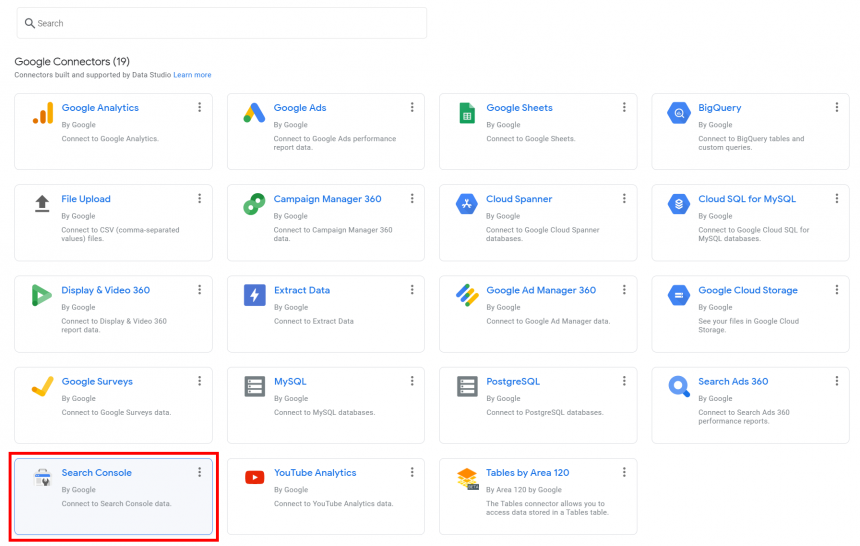
A new window will then open and you’ll be presented with the many different Google Connectors. Select “Search Console”.
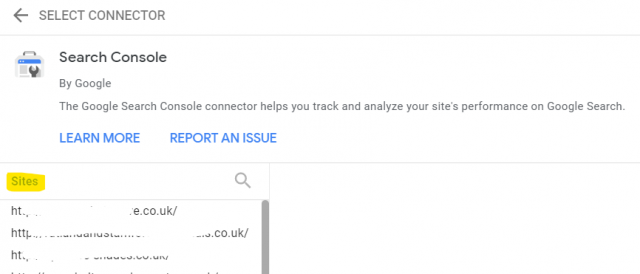
You will then be presented with all the GSC accounts that the Google account you are using has access to. From this list, select the account you want to use for this dashboard.
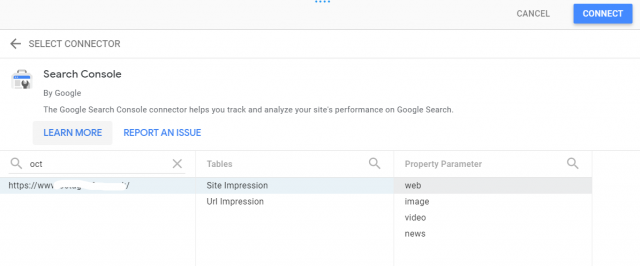
From here, select the following options that are presented to you, “Site Impression” and “web”, then click “Connect”.
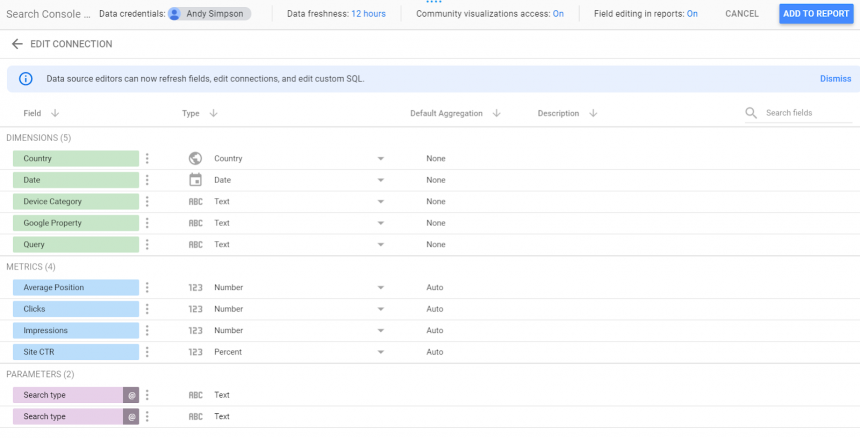
Almost there! Now choose “Add To Report” when you see the last window below.
Note: If you’re doing this for the very first time (i.e. you’ve never connected to anything in Looker Studio before), you’re going to be hit with a few popup data agreement windows from Google. There’s nothing to worry about here: you’ll just have to agree to the terms and you might just have to follow the process above again (from “copy report”), but this time you won’t get any annoying popup windows.
Below is what you should see now. The “New Data Source” should be showing the GSC data from the site you have selected, and now you can select “Copy Report”.
Phew, that’s it! It’s a bit of a chore to start with but, honestly, once you’ve done this a few times, it becomes all very painless.
Customizing the Looker Studio Report
Now you’re ready to customize your Looker Studio report so that it’s specific to you and your business.
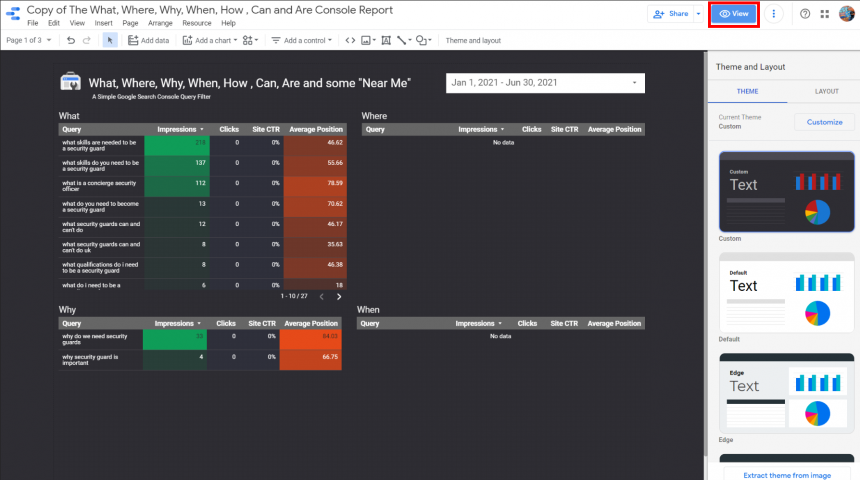
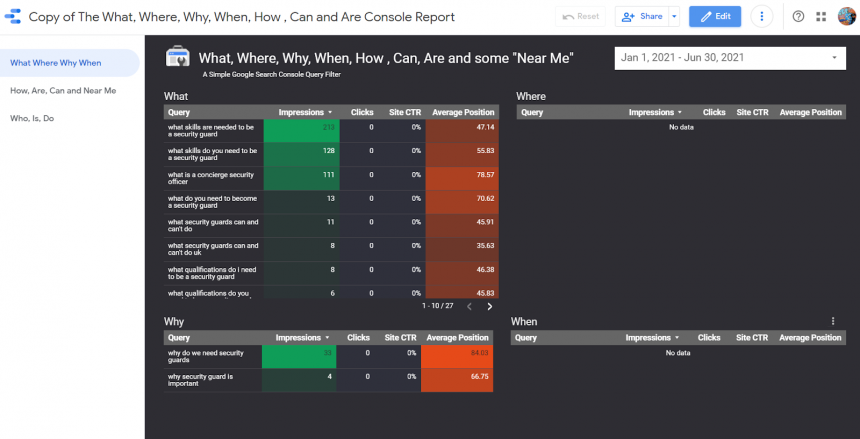
The first thing you’re going to want to do is view the dashboard, so select “View”.
Click around the report using the side navigation options as we did for the previous dashboard. You will now see (or won’t see) data in the related query tables.
Okay, now we’re ready to make changes and updates to the dashboard, so click the blue “Edit” button.
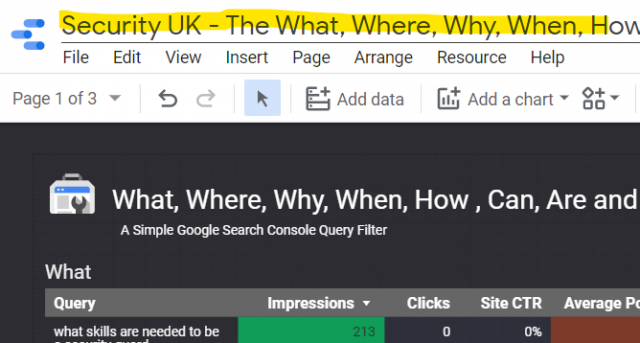
This is where we can edit, delete, and copy many different elements of the dashboard. Editing the existing copy is easy: just select the text you want to edit, and update it accordingly.
In the example below, I have renamed the dashboard so I know which client this applies to.
You can do the same for table headers and so on.
Time to get local!
Okay, let’s make this report more local. I want to see what local queries my users are searching for, so I want to see what queries include the town or city my client is in.
I need to:
- Make a copy of an existing page
- Change the tables to filter the queries to show that specific town/city.
So let’s do this before looking at the data.
You can copy any of the three pages we have at the moment but for now, let’s keep it simple and just copy Page 1.
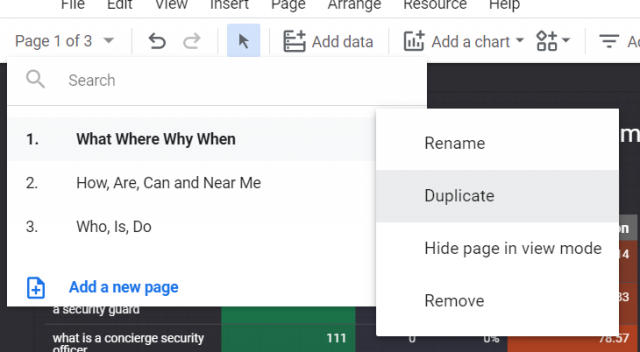
In edit mode, choose “Page 1 of 3” and you’ll see the dropdown options. Hover over the “What Where Why When” page.
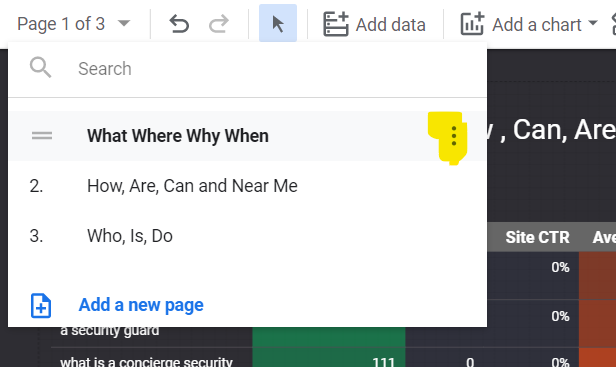
Click the ‘three dots’ and then choose “Duplicate”.
You have now made a duplicate of Page 1; this will now appear at the bottom of the pages and become Page 4 of 4.
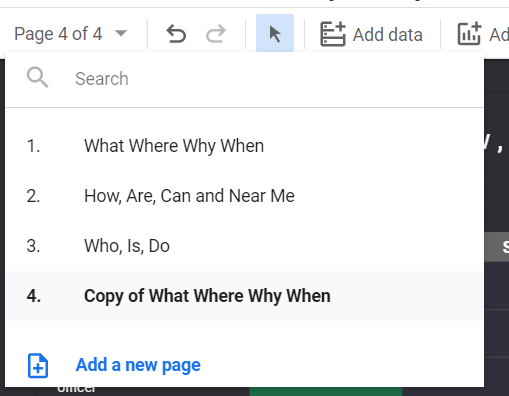
Now select this page. Choose the ‘three dots’ again and rename.
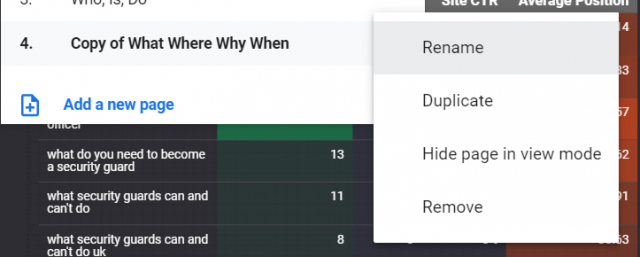
Name it as appropriate.
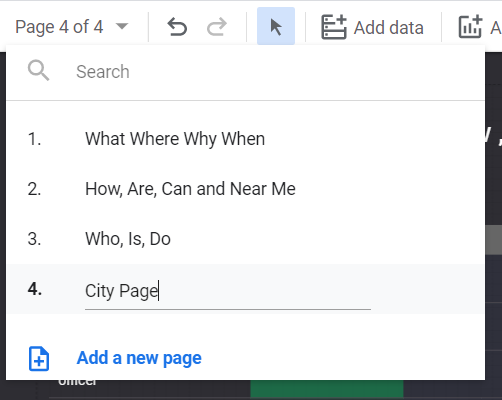
Top Tip: These dashboards can get very big, the more you play with different queries, local or otherwise, so naming your pages early saves you headaches later.
So you now have a copy of Page 1 that is ready to edit.
Firstly, let’s delete the bottom two tables. Just highlight the elements and press delete.
You should now be just left with two tables.
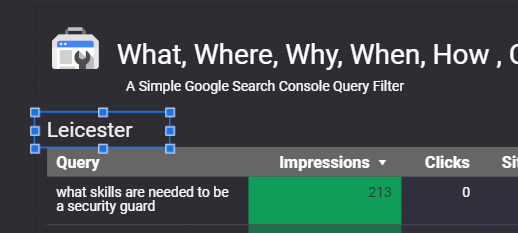
We are now going to change the first table to the city in which our local business is based. In this case, it’s Leicester in the UK.
Click on “What” and rename it to your town or city.
Now click on the table below so that it is highlighted.
This table is currently filtering for the search query that contains “what.” We need to change the filter now to “Leicester”.
Look at the right-hand side of the dashboard and select “Data” if it’s not already selected.
Move down the data column all the way to the bottom until you see “Filter”.
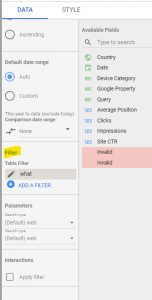
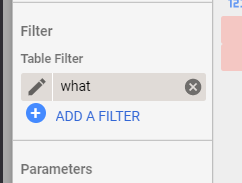
Remove the “what” filter by clicking the ‘x’ beside it, then select “Add a Filter”.
From here you want to select “Create a Filter”.
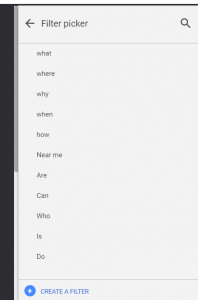
You can then create your own filter using your own town or city. Again, in this example we are using “Leicester.” Remember to choose “Query.”
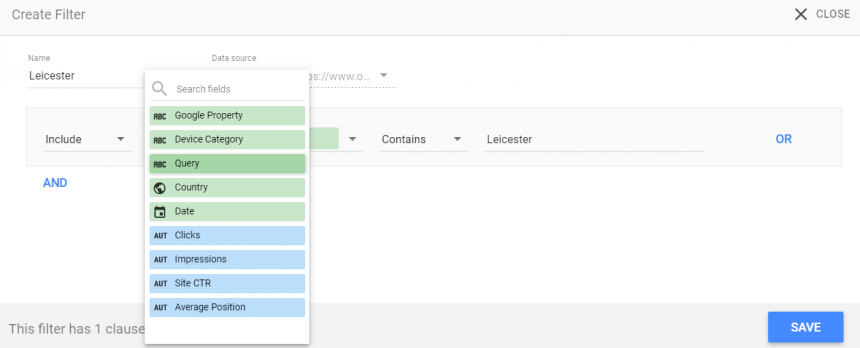
The end result should look something like the below:
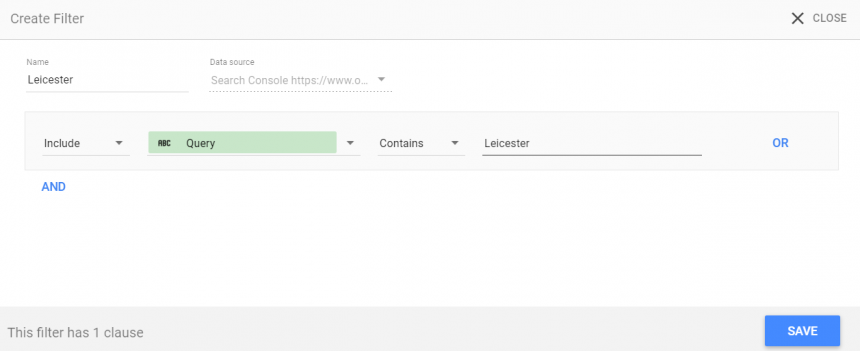
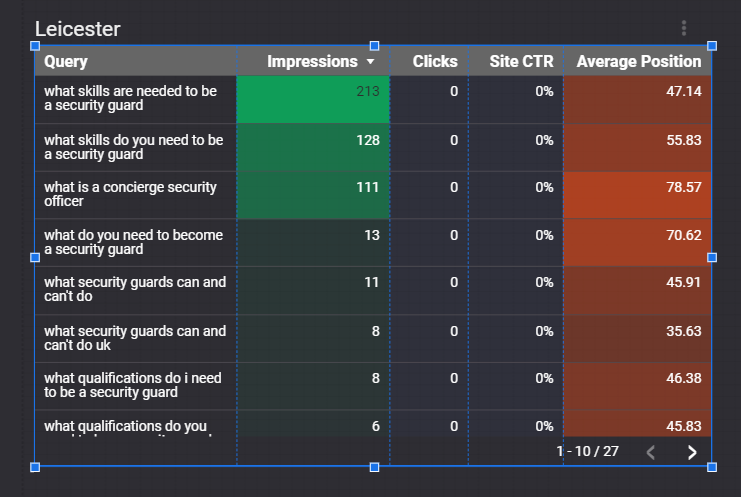
Click “Save” and now look at the updated table. It should now contain all the search queries that contain the city name.
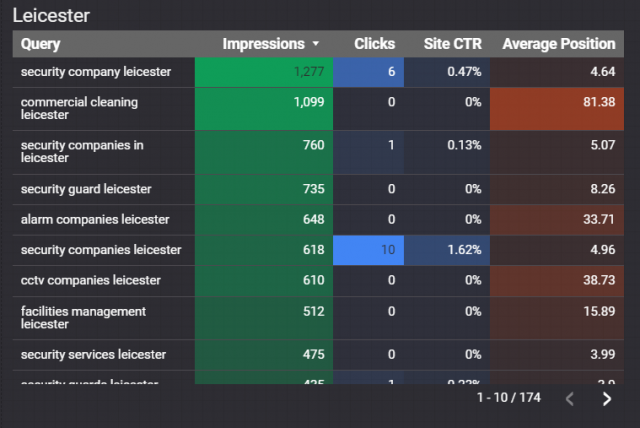
Now it’s time to focus on the data to see what you are, and are not, ranking well for.
Okay, for the second table we’re going to try a different filter: we’re going to filter on “UK.” Now if we use the same filter as we did above, the table will show queries for all words that contain the letters “uk;” we just want the query “UK”.
Note: I particularly find this useful for state searches here in the USA, where I need to filter on the different States such as NJ, NY, FL, CA, etc.
For this we’ll need a special piece of Regex:
^uk .*|.* uk .*|.* uk$
So again, rename the table header to “UK” and then highlight the table.
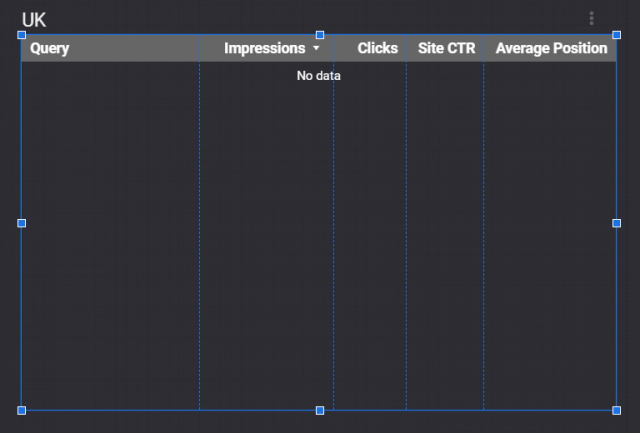
Move down to the “Filter” options and remove the current “Where” filter.
“Add a Filter” and select “Create Filter”.
Your filter should then look like this:
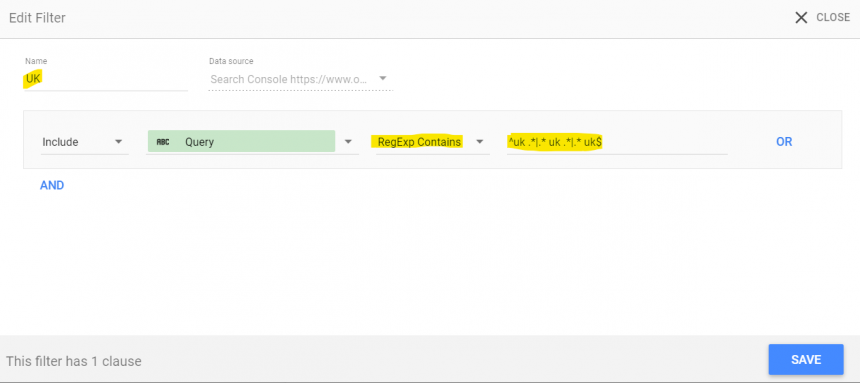
Note the “RegExp Contains” option and just paste in your updated regex into the last field.
For another example, if I wanted to filter on search queries for Florida, FL, then the regex would be:
^fl .*|.* fl .*|.* fl$
I just copy and edit in a notepad app and then paste it into this field.
Save the filter and then look at your updated table in “View” mode.
You can now drill into the data and make content decisions for you and your business.
If the data looks bad, then perhaps you need to take a good look at your content and work on missed opportunities!
AI Overview Trigger Queries
Both dashboards include a new “AI Overview Opportunity” section. Google’s AIOs cannot be tracked easily and don’t appear in your GSC data identified as AI Overviews, but what we can do is filter out all the common triggers that create an AIO and display them easily in the dashboard. Links in AIOs often show as “position 1” in Search Console, so look at your data and identify AI Overviews your site is currently getting.
Again, we are using regex to filter these results, this filter groups together all the common triggers that we see AIOs appear for.
The regex used can be seen here:
^(who|what|whats|when|where|wheres|why|how|which|should)\b|.*\b(benefits of|difference between|advantages|disadvantages|examples of|meaning of|guide to|vs|versus|compare|comparison|alternative|alternatives|types of|ways to|tips|pros|cons|worth it|best|top)\b.*
Reference: Jes Scholz on X (Twitter).
Don’t forget, you can still use the other data tables found in the other dashboards that may well give you AIO ideas to test and aim for.
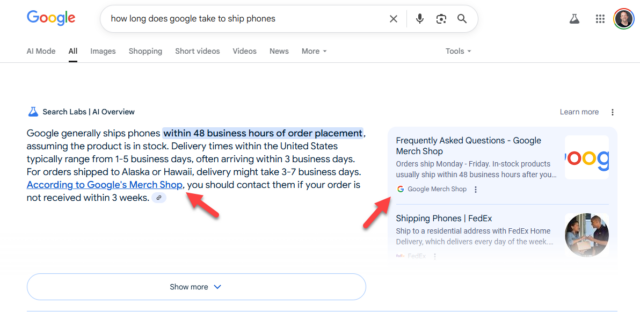
Example:
Here we see an AIO, which shows reference to the Google Merchant Store.
We can see this AIO query in our dashboard under the new “AI Overview Opportunities” tab.
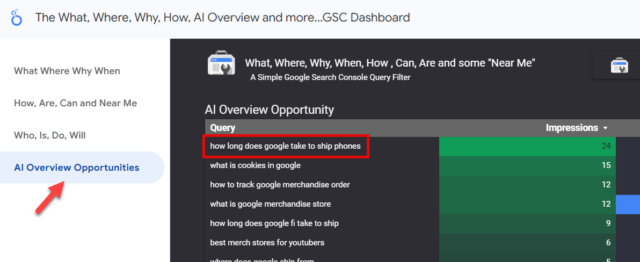
With the increase in AIOs in search and local search, knowing what your site is appearing for in Google is becoming increasingly important. Using these dashboards should help you start to understand what your users are asking to find your site, and how that information is being displayed in search.
Conclusion
Once you’ve created one or two of these custom dashboards, they soon become a breeze to create along with your own specific filters.
I use this dashboard for all of my clients, and the query filter has endless uses. You can filter on towns, cities, states, and brand names, or filter down to product/service level queries, i.e., look at the queries that contain some of the keywords of the services you offer.
I hope you find these dashboards useful, and please feel free to share this post to spread the word! If you have any questions on using them, please don’t hesitate to leave a comment below or reach out to me on Linkedin or Bluesky.
Contents
