


Local SEO consultant Tim Kahlert runs his own Facebook group, where he brings people together to share their own client problems, from Google My Business quirks to the best ways to report, and he often takes on the role of SEO Agony Uncle in the process.
As an avid user of Local Search Grid, Tim was perfectly placed to share how he uses the geo-grid tool and offer some expert advice, too.
Read on to hear from Tim and gain insights into how he puts into action the powerful data that LSG supplies.
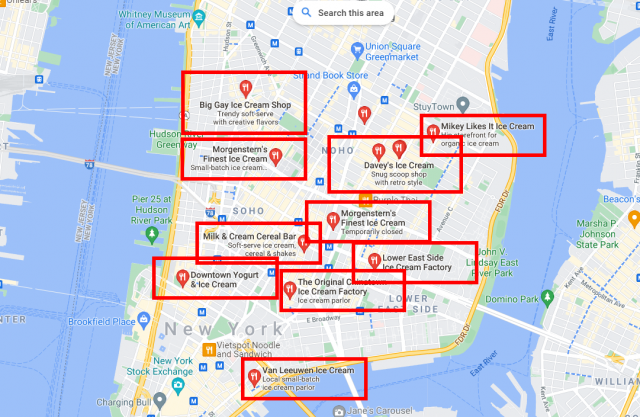
Local Search Grid is a powerful new search tool that shows you where your Google My Business listing ranks from multiple points across the geographic area where your business is located or where it serves.
This local rank checker is really great for ensuring that your listing is optimized for visibility at locations where it matters. You can test out different keywords and see where they perform the best, so you know the data that really counts when optimizing your listings.
In this article, I’ll explain why I like Local Search Grid, how I use it, and the best ways to make sense of its insights. It’s one of the first things you should check out when you learn how to use BrightLocal.
Why I use Local Search Grid
Local Search Grid helps me to monitor local search rankings and report ranking changes to clients by providing detailed data that wasn’t available through a traditional rank checker.
Every local SEO client has a different understanding of how local search works, and I have seen two main approaches to looking at rankings:
- The first approach to monitoring local SEO is that clients would only check their rankings from their individual location, mostly seeing great results due to the close proximity from the searcher to the location. This method is problematic because it artificially inflates the success of the business’s performance in maps.
- The second approach I’ve noticed clients have is to physically get in their car, drive around, and check their rankings from all possible areas, which is time-consuming and can provide inaccurate or biased results.
The distance from a searcher to a local business strongly influences the degree of relevance of local search results; local search rankings depend on the geographical position of the searcher.
A traditional rank checker only shows results for one location, and it can be very time-consuming to test searches from different locations for each of your keywords. You could quickly end up performing 1,000 searches just to get an overview of the local rankings in your specific area.
Time is our most valuable asset, and using Local Search Grid can help you save a lot of it.
Using this type of geo grid rank tracking tool offers other benefits, too: it can help to bring clients peace of mind and clarity, and it provides data and views which are visually appealing and easy for clients to understand.
Later, I’ll be talking through how I use the data in these reports to improve my strategy, but first I’ll be explaining how best to set up your reports.
How to use the Local Search Grid in three simple steps
Before you get started creating your grid, you can make your life easier by taking the following steps:
The first step you want to take is to find your GMB verification address. This is the address that you submitted to Google to be verified and should be the address shown on your GMB listing. Google uses this address to determine local rankings, so using the correct address is critical to get accurate grid results.
Next, to avoid wasting many search grid points, try to imagine your service area. By this, I mean the area where your customers usually come from (not the area you’d like to target.) This will make it easier for you to determine your search grid radius.
Finally, determine your 3-5 most important keywords. Most local businesses have at least three primary keywords or search terms they want to rank for. They mainly consist of “service”, “service near me”, and “service in <name of city>”.
Update: In September 2022, BrightLocal upped the keyword limit of Local Search Grid to 30 keywords per location—that’s six times more ranking insights!
How to create your first Local Search Grid report
Getting started with your first grid is easy. Here you will find all of the details you need in order to run a successful report.
On your Brightlocal dashboard, go to rank tracking and click on ‘Local Search Grid’ and ‘Add new’.
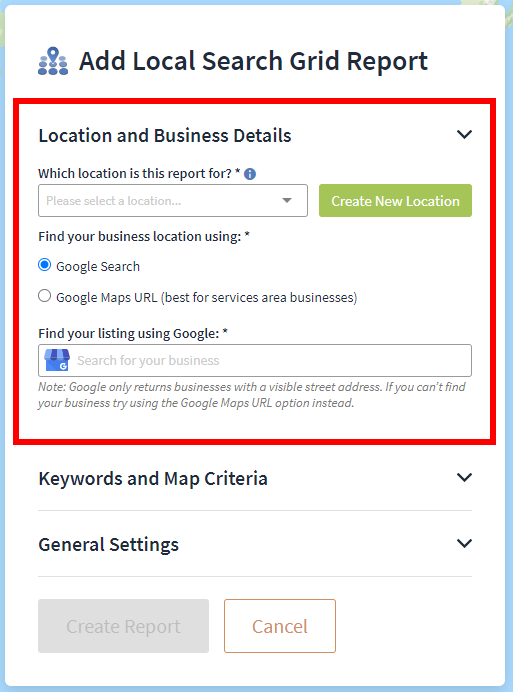
1. Location and Business Details
The first thing you need to do to get started is to enter your GMB location. You can either do this through Google search or the Google Maps URL of your GMB profile. Google Maps URLs are mainly used for pure service-area businesses.
2. Keywords and Map Criteria
Here you can enter the most valuable keywords that you determined earlier.
The next step is to choose a grid size. I recommend you always select the max grid size for the most precise results. It’s also so much more visually appealing to the eye than having only a small number of dots.
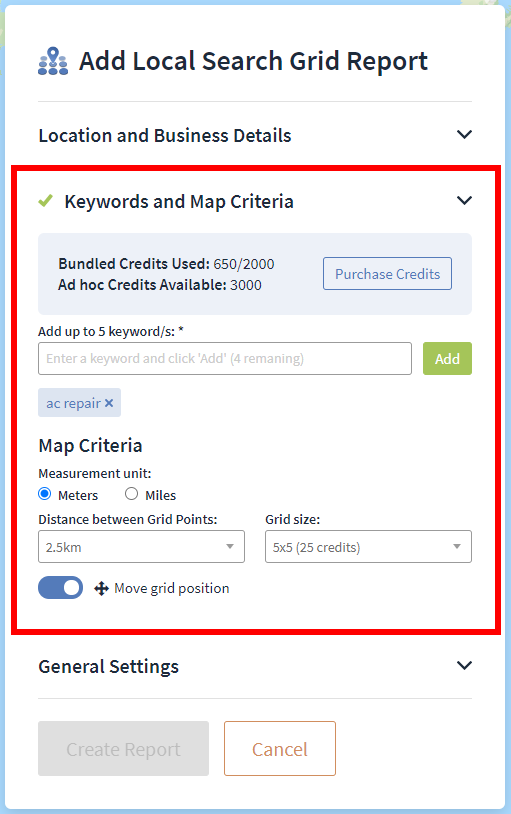
If you want to have a quick overview and see whether your business shows up in search or not, smaller sizes should do, too. The more grid points you choose, the more accurate your findings will be. A high accuracy leads to better adjustments.
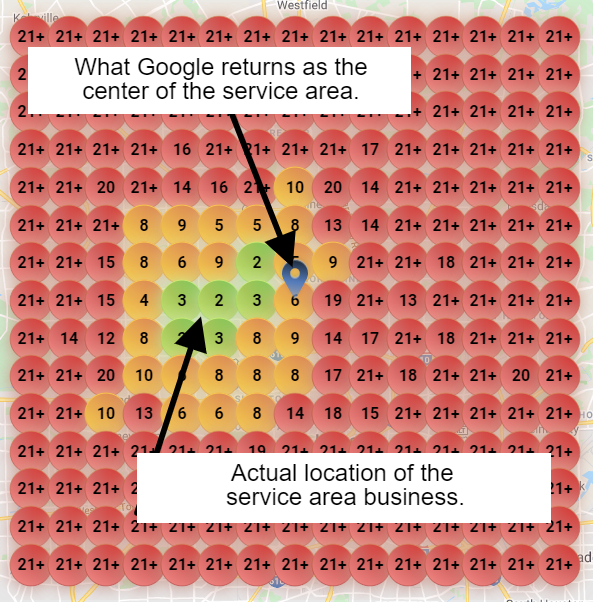
If the grid, for whatever reason, is not at your desired address on the map, drag the center point of the grid and drop it on your verification address. If you don’t know the address you’ve used to verify the listing anymore, contact Google’s support team. Google doesn’t store that piece of information for you.
After you’ve determined your favorite grid size, you need to test different distances between the grid points to target your perfect ranking results area. The ideal grid distance is when you’re able to track improvements over time.
As the number of green and orange points is supposed to increase, you’ll need some red rows that can be turned orange or green. Otherwise, your tracking would be useless. If there is not much room for improvement on the grid, you’ll have to use a new grid size each time your rankings change. That makes it hard for you and your clients to compare results. Comparing two different grid sizes is like comparing apples and oranges — there is nothing to gain from it.
Now you need the list of your customers’ address details. Meaning, you should match the distance between the grid points to your actual real-life service area. Choose a slightly bigger area than where your customers usually come from. Since the first run will be a simple test, you don’t need to worry about the accuracy of the grid points distance you’re going to determine.
Leave the locked grid position turned on and move on to General Settings.
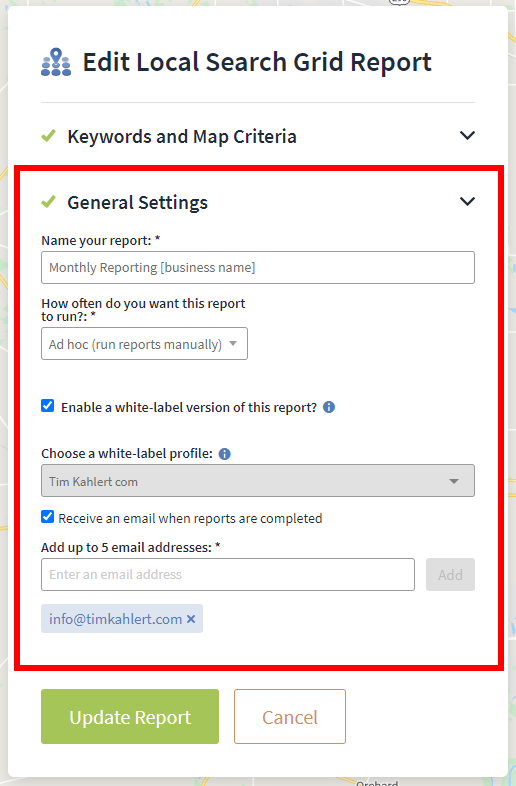
3. General Settings
The general settings include the name of the report and the frequency you want the report to be run at. I usually choose ‘weekly’. The more frequently you run the reports, the better you can conclude specific rank changes. Ask your clients how often they want to see grid results and adjust the frequency accordingly.
For example, a monthly report might be a good choice for clients who stay with you long-term and know that SEO takes time. However, you can still run weekly reports while showing your clients the changes every month.
How to find the right grid size for you
After you’ve performed your first report, have a closer look at it. As mentioned earlier, it’s a test run that requires additional adjustments. There are two things to look out for:
- If the two outer rows include many green grid points, the distance between the grids is too small as you most likely didn’t catch all the areas where your rankings are significantly different. Try to adjust the distance in a second report to see all orange and green dots on the grid.
- The four outer rows consist of red 21+ grid points only. This happens if the distance between the grid points is too big. Try to zoom in and try a decreased distance in another report.
My recommended goal for getting optimal grid spacing is to choose a space where the two outer rows are at least red so that you have room for improvement while keeping the results accurate enough. A brand new business with much more room for improvement than an established business should get more red 21+ outer rows. However, nothing is set in stone, and the individual setting depends on how you evaluate your specific situation.
When you’ve found your perfect settings, you can use them for your weekly or monthly reporting for your clients.
How to make sense of your Local Search Grid data
In this section, I’ll share with you how I make sense and gain insights from the data that Local Search Grid hands out.
How do I know if there is actually room for improvement?
There is no way to tell for sure whether you reached the peak because ranking updates happen daily, and no one can predict anything. However, there are indications that you can follow to learn more about your specific local ranking situation.
The table below the visual search grid shows competitors based on the center of the grid you chose. If you’re #1 on that list, great! If you’re #2 or worse, there is most likely room for improvement.
Another way to tell whether you can grow your ranking area is by looking closely at the local ranking factors and improving your online presence accordingly. There is usually something you can work out, like getting more online reviews or optimizing your Google My Business listing.
Consider competition and your area’s infrastructure
In competitive spaces, it usually makes more sense to choose smaller distances between grid points. There are either a higher number of competitors or competitors with a solid authority level in such a market, so it will be harder for you to expand the ranking area. If the main share of your customers comes from Google, it can make sense to open up a new location in a place where the market hasn’t been satisfied yet.
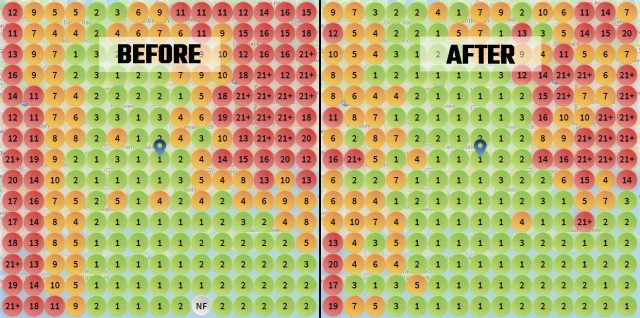
Compare ‘befores’ and ‘afters’ of rankings
As I’ve mentioned before, only equally-sized grids should be compared with each other as data consistency is key to professional reporting. The change in rank of each individual point must be clearly recognizable. The creation of replicable data is mandatory when starting to track with a Local Search Grid report. You or your clients can only take advantage of data change if it’s 100% consistent, accurate, and understandable.
For you to create a visually appealing and understandable document for your clients, you can either send external white-labeled reports through BrightLocal or create your own report document.
Your clients need to see before and after visuals so that they can directly reproduce the rank changes. This can be a video or screenshots of your before and after grids.
Closing thoughts
Local Search Grid is an indispensable tool that helps you get an overview of the rankings in your local area and visualize local rank tracking.
Apart from seeing the data at a glance, people love to consume exciting and appealing content (the grid’s color-coding makes for a great visual experience!)
For me, I would always prefer to use a tool like this over general rank trackers or tabularized data for client reporting, and, hopefully, this guide helps you to get the most out of Local Search Grid, too!
What’s your favorite way to use Local Search Grid? Drop us a line in the comments!